 |
|
|
| |
|
|
This website examines the performance of the GPS satellite orbits determined by each Analysis Center (AC) participating in the IGS Reprocessing Campaign #1. A companion site looks at the associated polar motion time series. Orbits for the 3075 days (i.e., 3 segments of 1025 days) through week 1459 (end of 2007) have been used to obtain consistent, comparable, and modern results from all ACs. This span covers epochs from MJD 51391 through 54465, which corresponds to the period 01 Aug 1999 (week 1167_3) through 31 Dec 2007 (week 1460_1). In the cases where more than the usual 96 15-minute epochs are reported in the AC SP3 files, only those between 00:00 and 23:45 are used here.
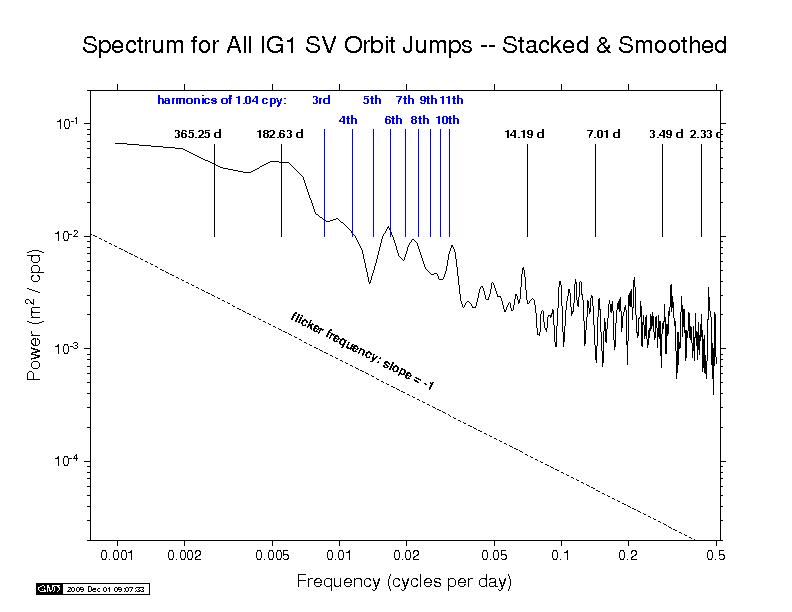
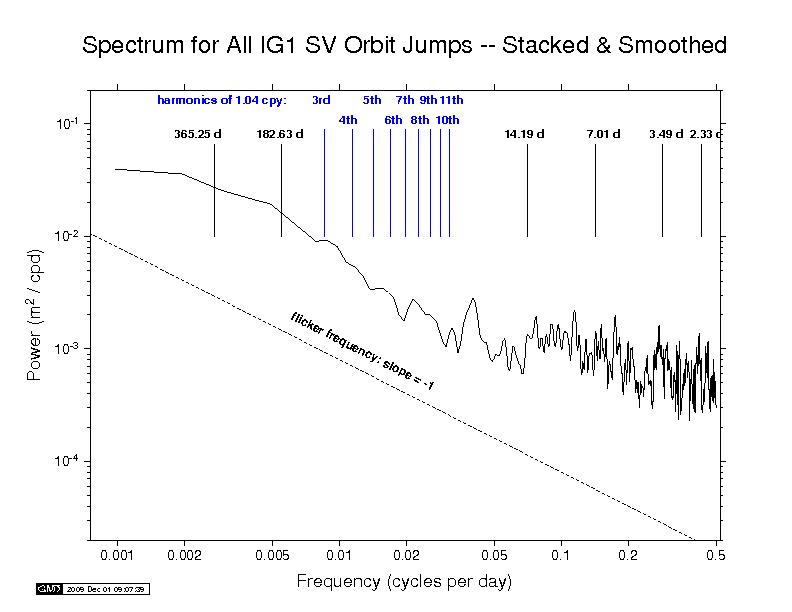
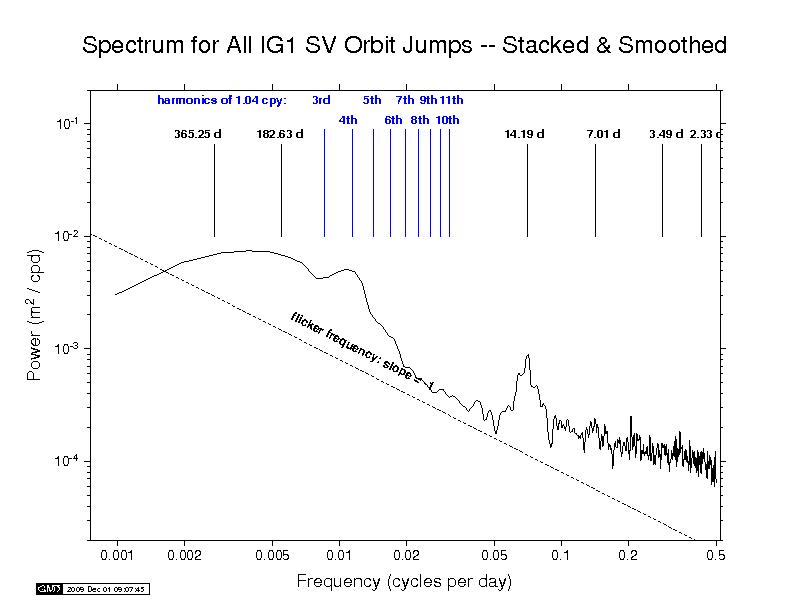
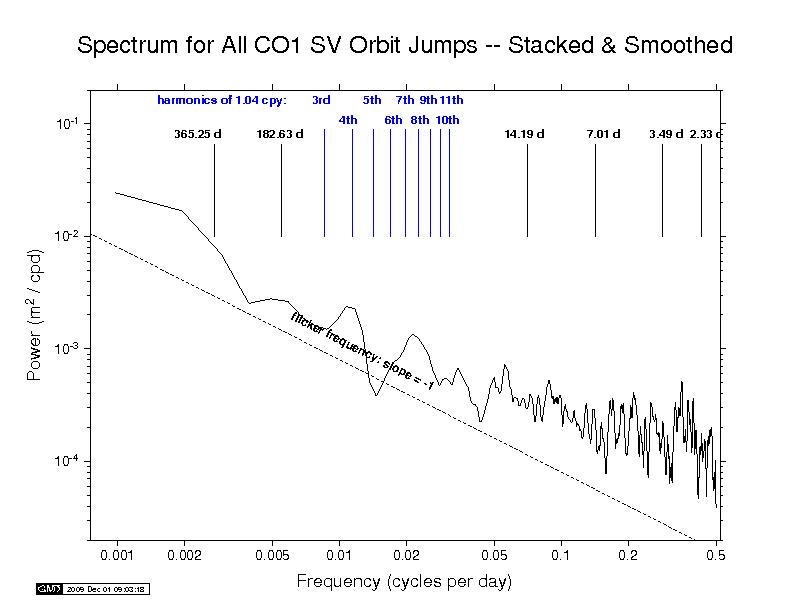
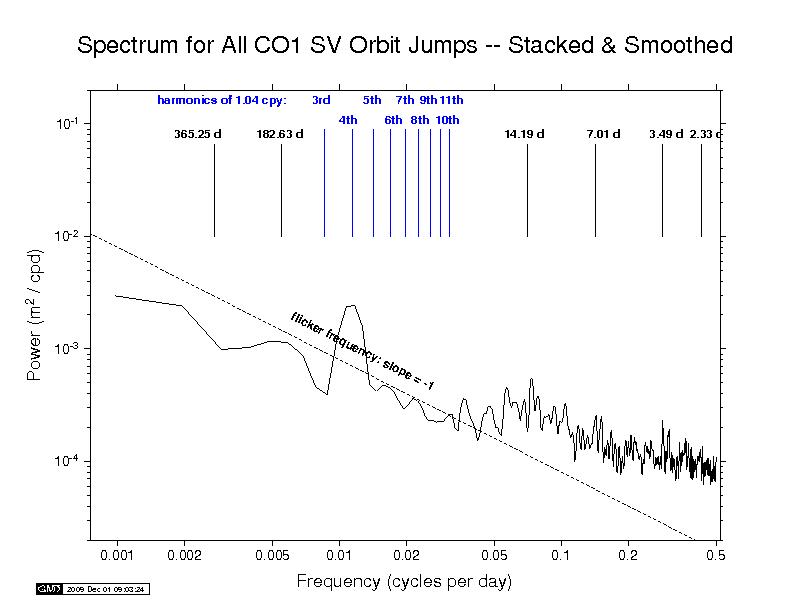
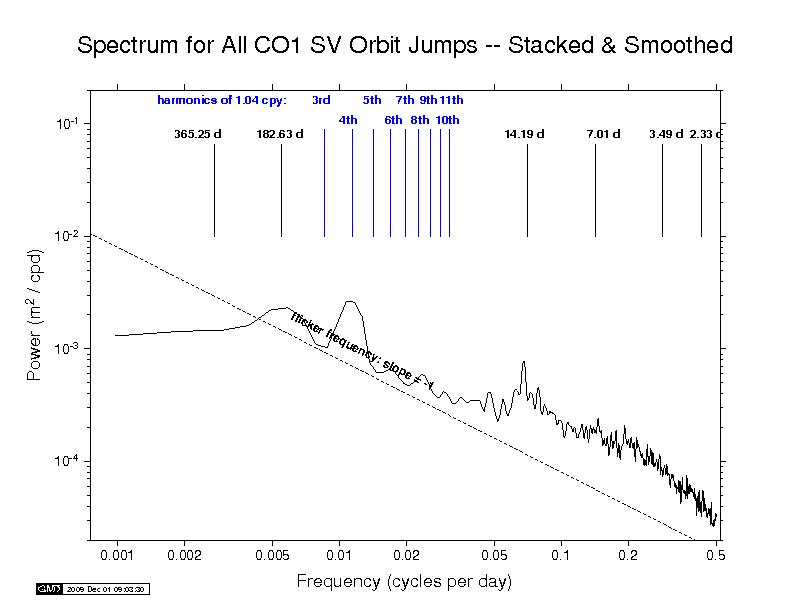
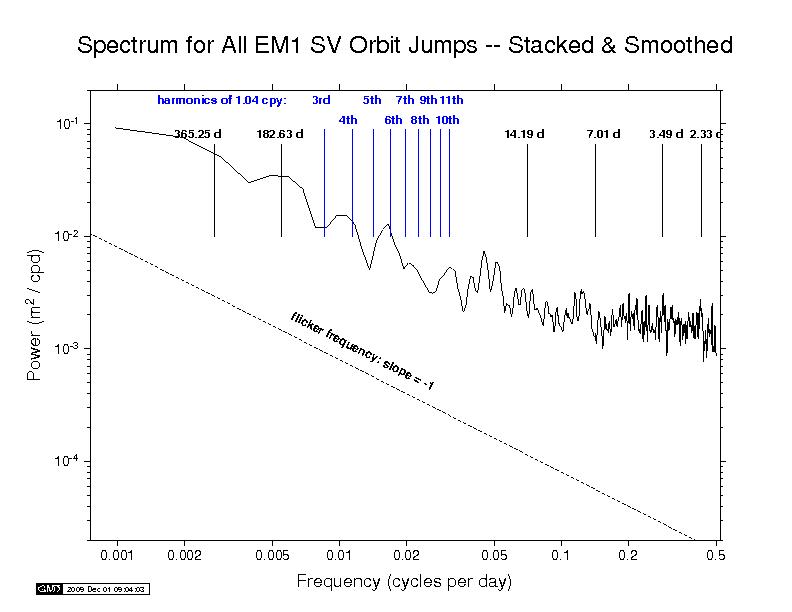
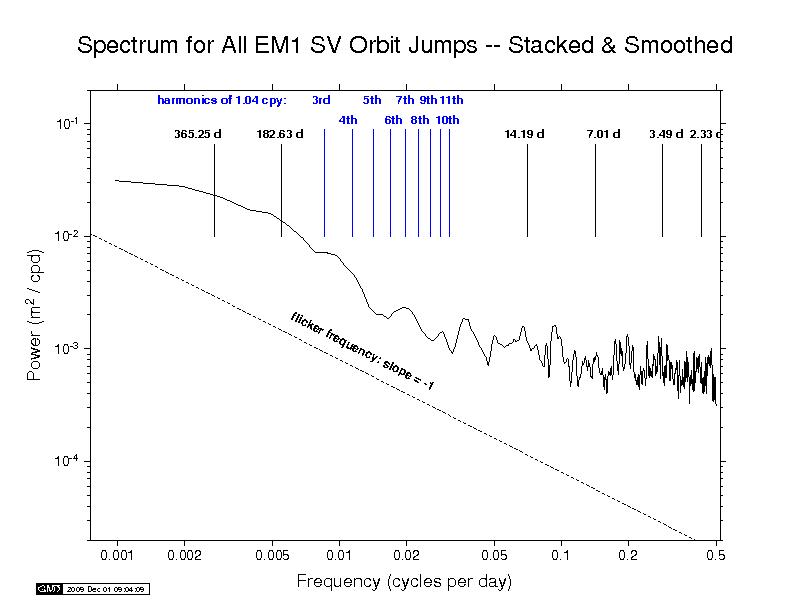
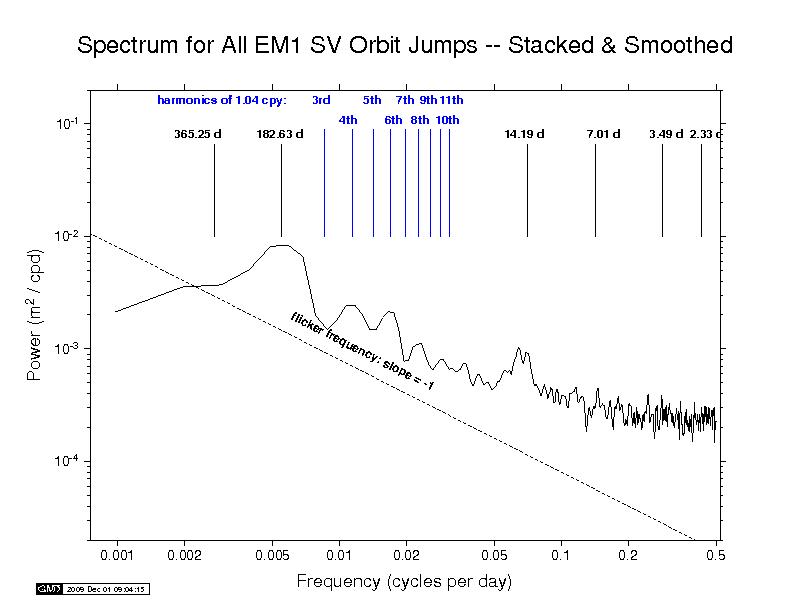
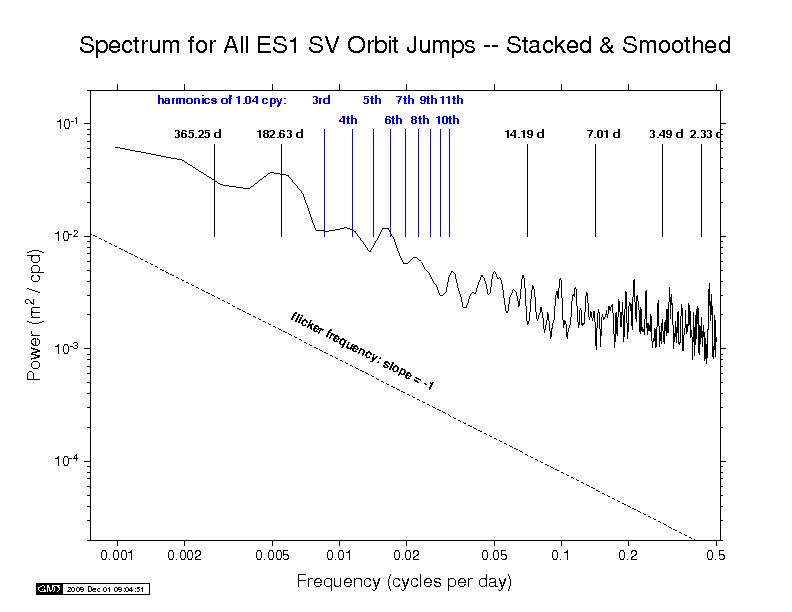
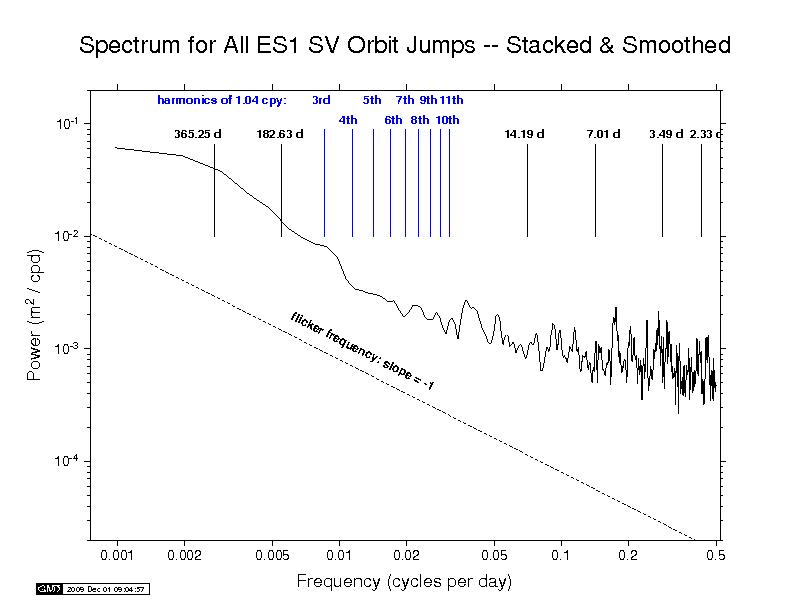
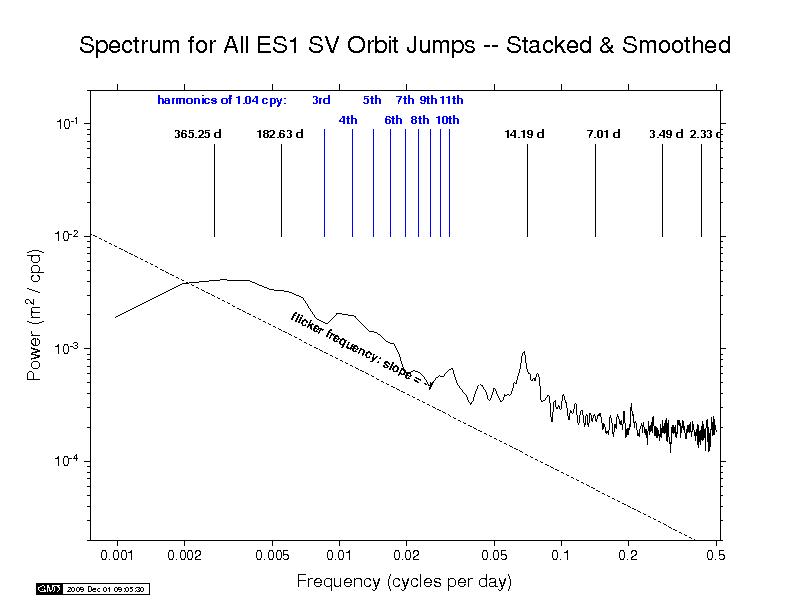
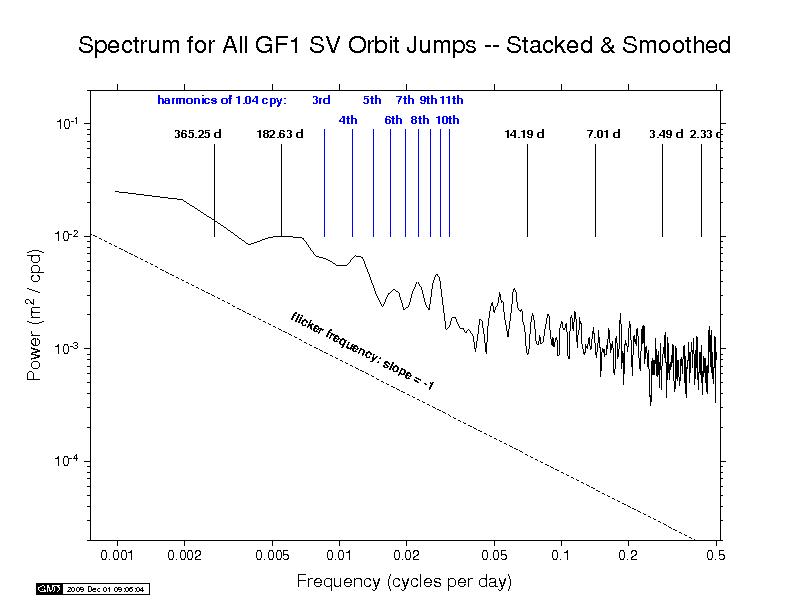
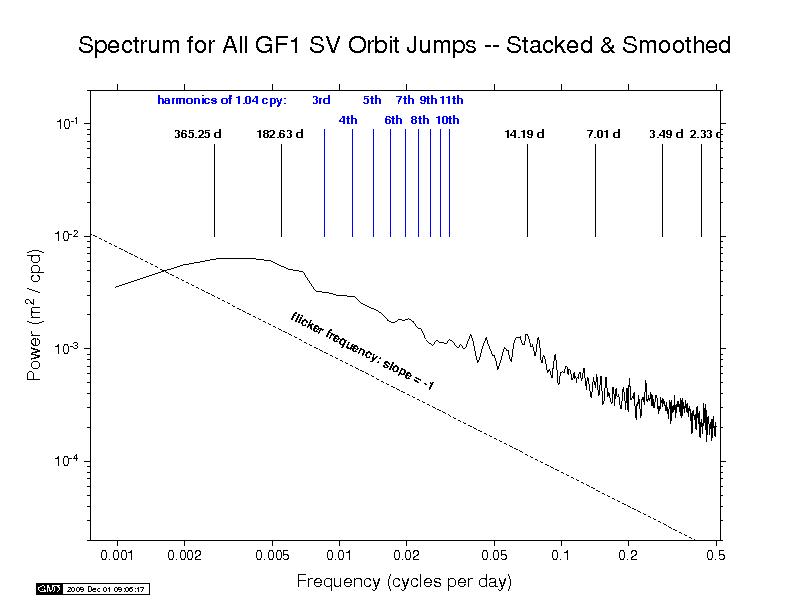
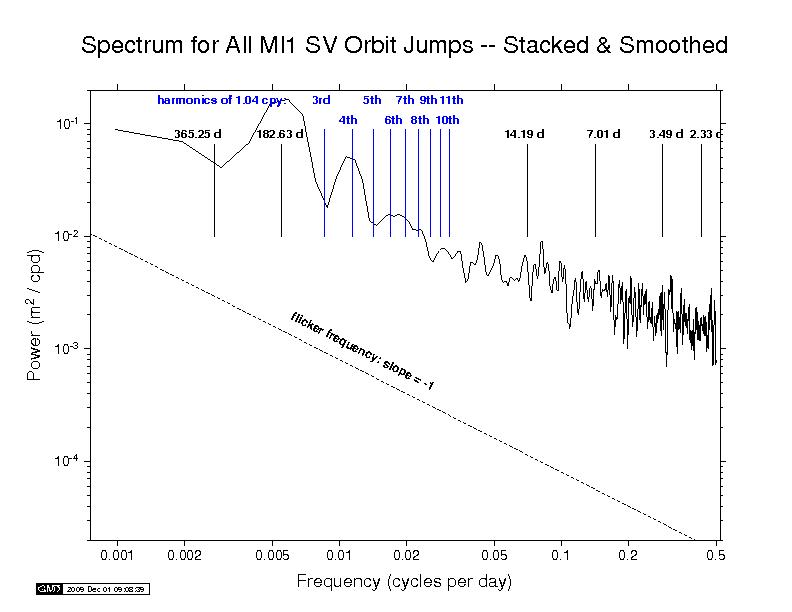
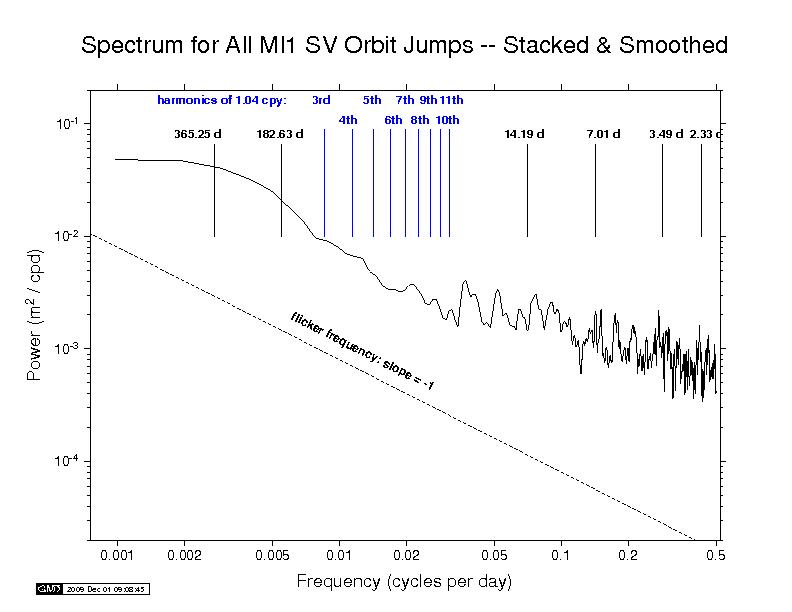
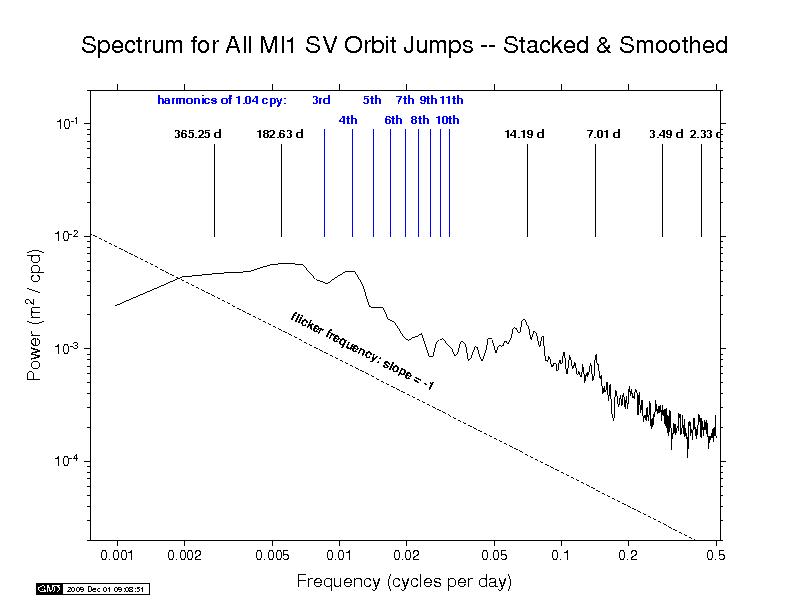
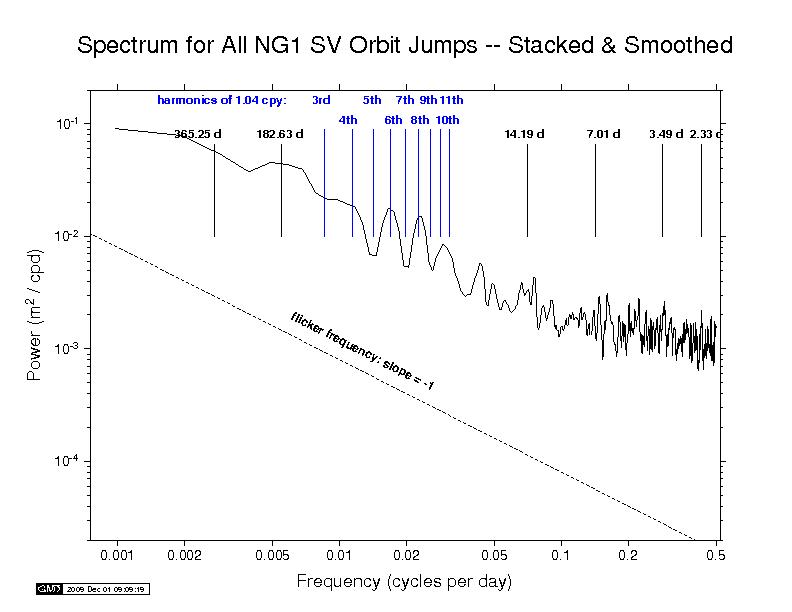
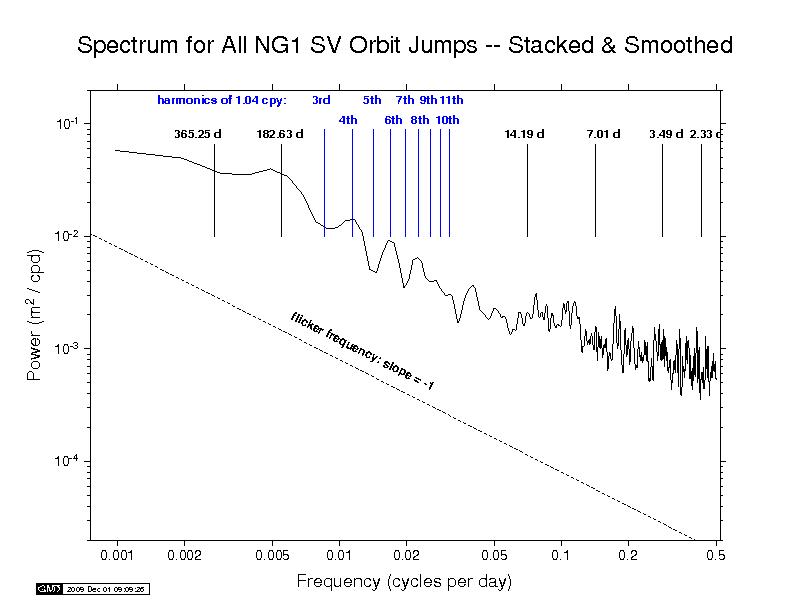
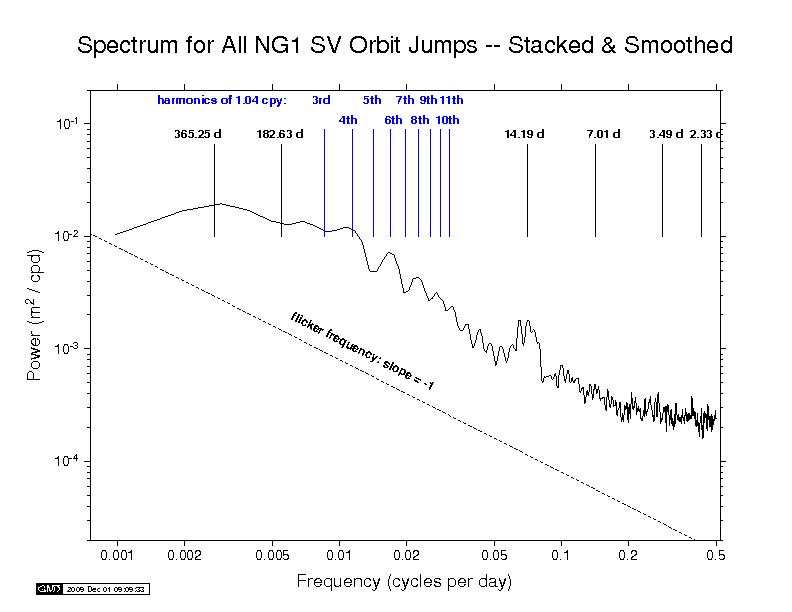
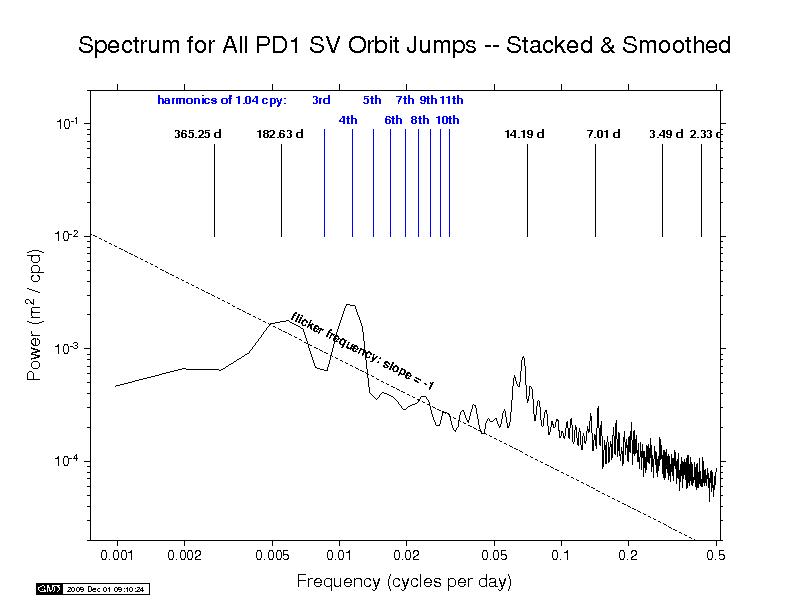
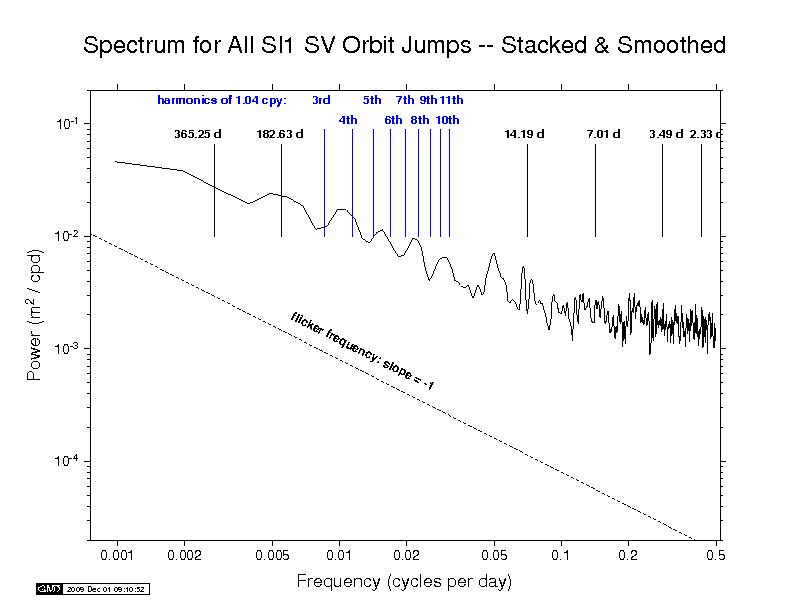
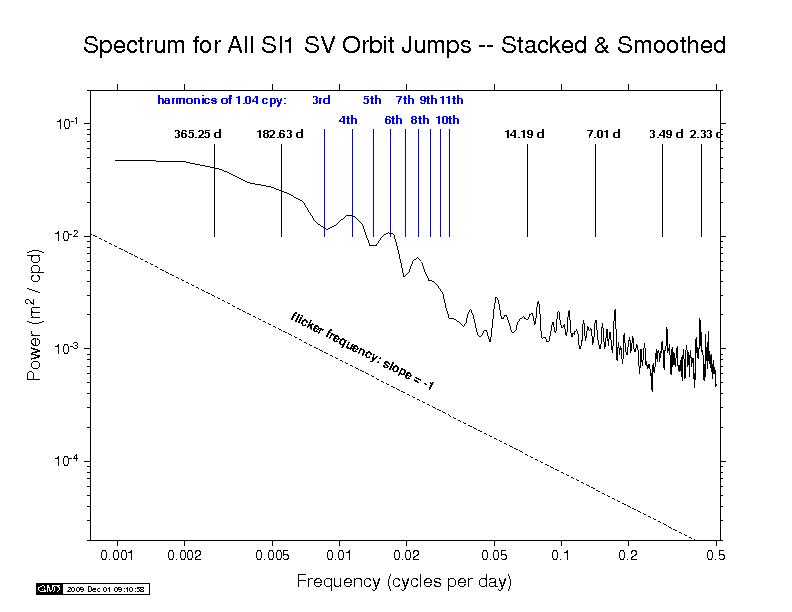
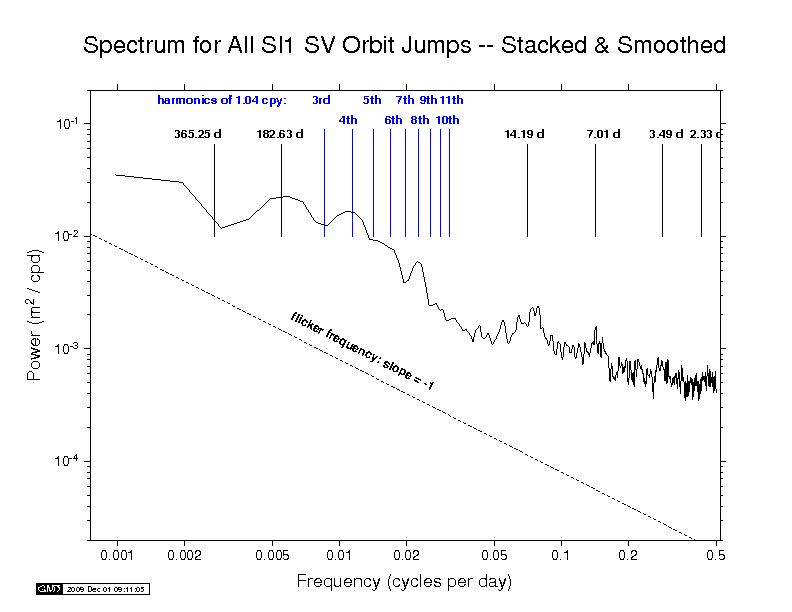
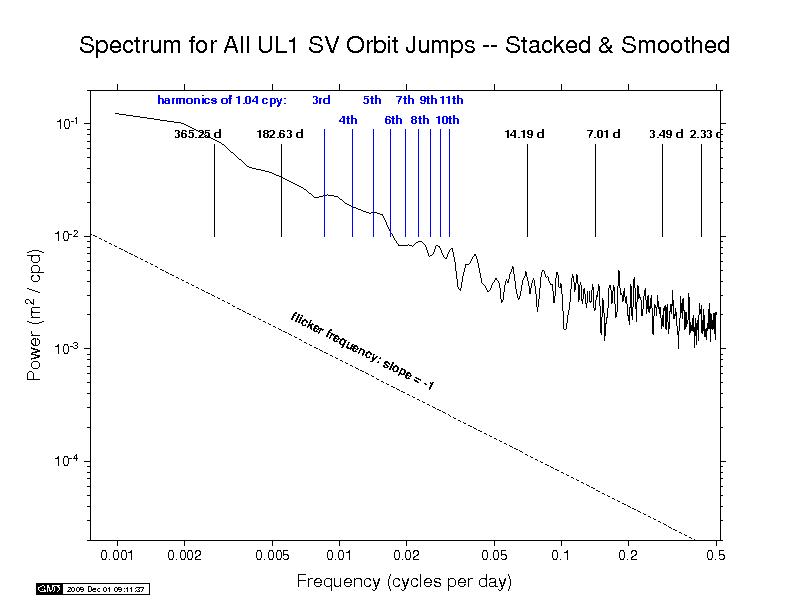
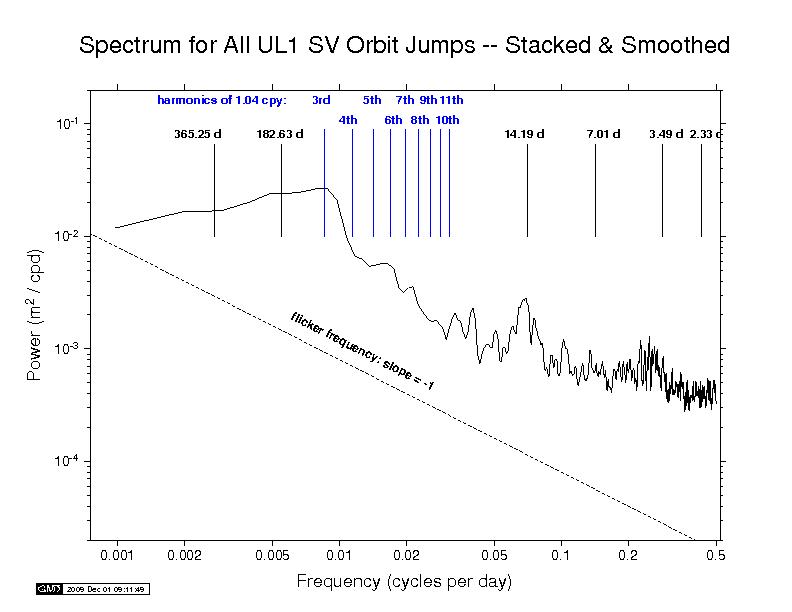
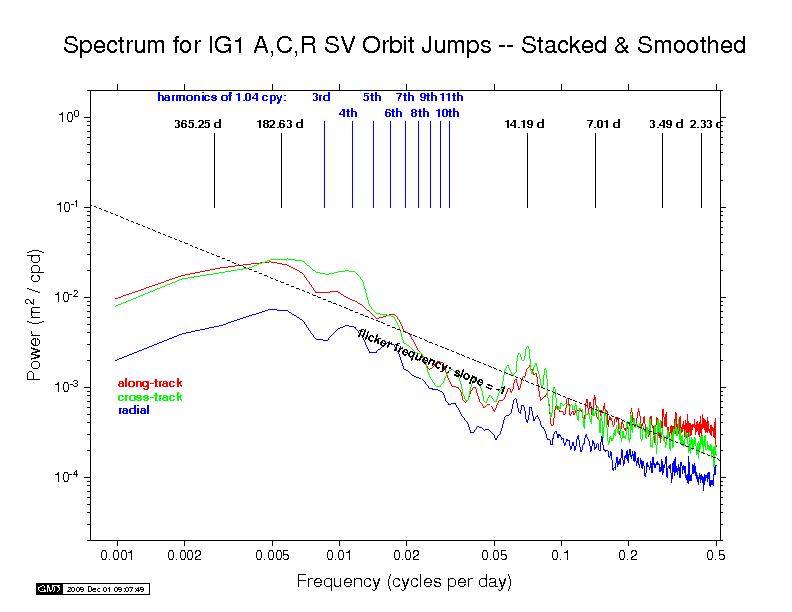
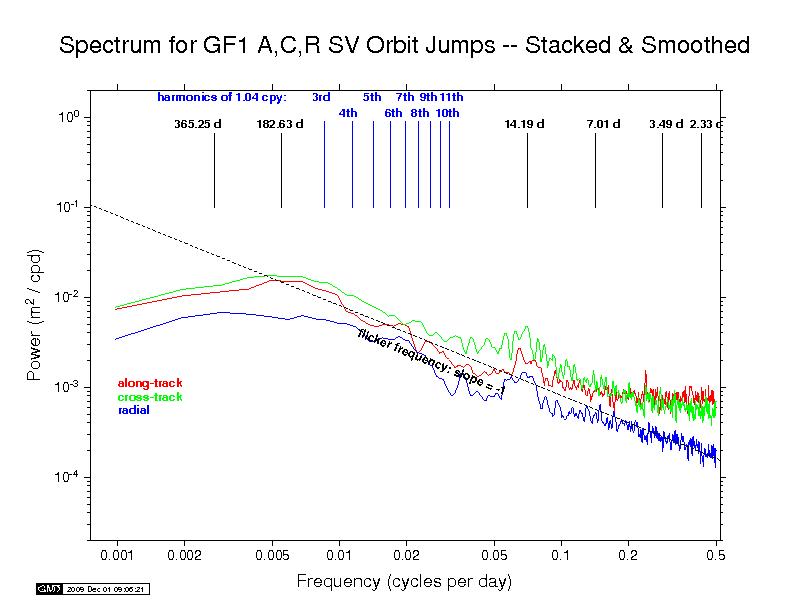
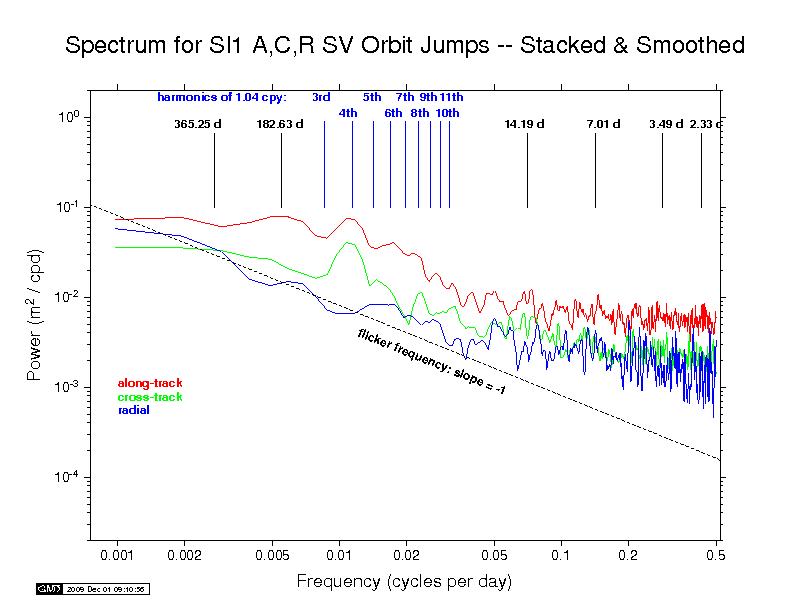
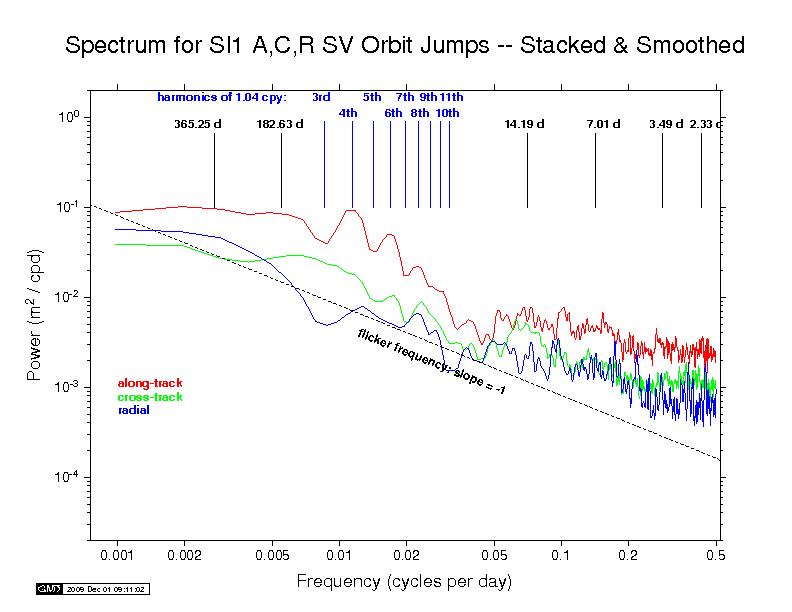
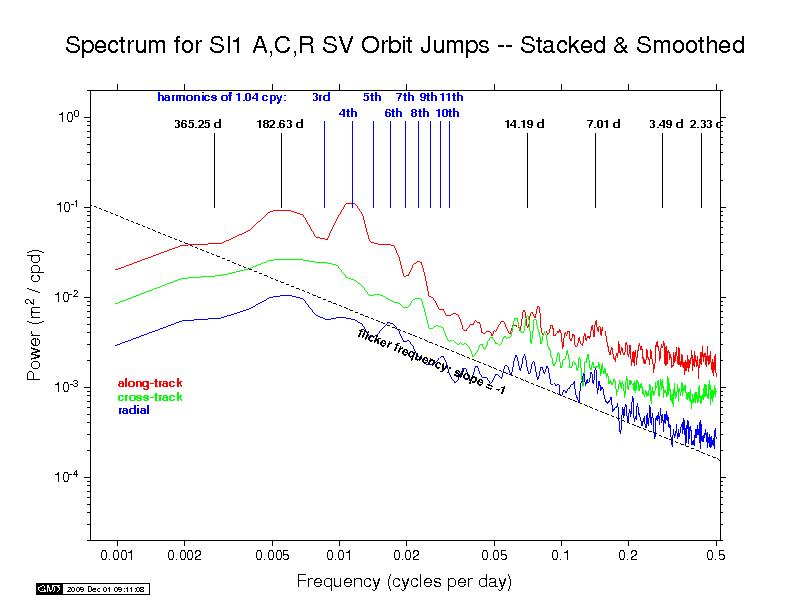
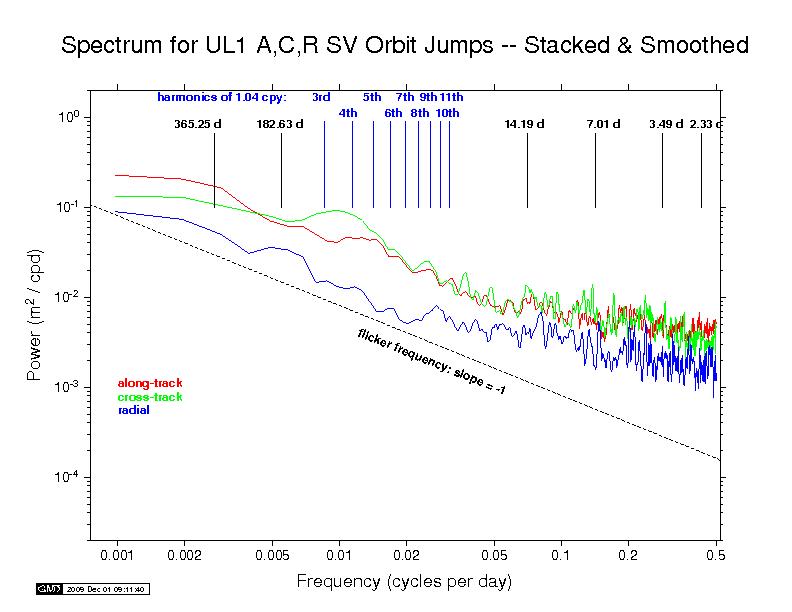
As there is no absolute knowledge of the true GPS orbits, we use a measure of satellite position repeatability to characterize each AC product set. Each daily AC satellite ephemeris for each pair of consecutive days has been treated as pseudo-observations in a fit to the extended CODE orbit model (three position and three velocity parameters plus nine nuisance solar radiation parameters), then extrapolated to the mid-point epoch between the days, and the geocentric satellite position differences computed to give time series of 1-D orbit repeatabilities for each satellite and AC. Occasional data gaps have been filled by linear interpolation, then FFT power spectra computed, and the spectra stacked over the full GPS constellation for each AC and lightly smoothed in frequency (using a sliding boxcar over each three adjacent frequencies). Results are shown in the plots below.
In an earlier application of this method to operational IGS combined GPS orbits, Griffiths and Ray (2009) found the error introduced by the fitting and extrapolation process to range between 0 and 8 mm (mean = 3 mm) per geocentric component with 3D differences of 3 to 10 mm (mean = 6 mm). So, the effect of the orbit fitting-extrapolation process nearly always adds insignificant noise to these day-boundary orbit comparisons. That conclusion is also evident in the obvious diversity of results among AC orbits found here.
Most continuous geophysical processes and most physical noise processes
possess power spectra that decrease as the frequency raised to some
characteristic negative power ("spectral index"). The spectra are usually
"reddish" in the sense of having more power at the lower frequencies
(i.e., longer periods). For reference, a power law with spectral index
of -1 is drawn on each plot (not a fit). This corresponds to the
behavior of a flicker phase noise process. White noise has a flat
power spectrum independent of frequency and probably explains the
asymptotic high-frequency flattening apparent in most AC spectra.
Several interesting spectral lines are also indicated in each plot
below.
|
Seg 1: Aug 01, 1999 through May 21, 2002
|
Seg 2: May 22, 2002 through Mar 11, 2005
|
Seg 3: Mar 12, 2005 through Dec 31, 2007
|
  IGS —
ps file IGS —
ps file
|
 IGS —
ps file IGS —
ps file
|
 IGS —
ps file IGS —
ps file
|
|
|
||
 COD —
ps file COD —
ps file
|
 COD —
ps file COD —
ps file
|
 COD —
ps file COD —
ps file
|
 EMR —
ps file EMR —
ps file
|
 EMR —
ps file EMR —
ps file
|
 EMR —
ps file EMR —
ps file
|
 ESA —
ps file ESA —
ps file
|
 ESA —
ps file ESA —
ps file
|
 ESA —
ps file ESA —
ps file
|
 GFZ —
ps file GFZ —
ps file
|
 GFZ —
ps file GFZ —
ps file
|
 GFZ —
ps file GFZ —
ps file
|
|
N/A JPL —
ps file
|
 JPL —
ps file JPL —
ps file
|
 JPL —
ps file JPL —
ps file
|
 MIT —
ps file MIT —
ps file
|
 MIT —
ps file MIT —
ps file
|
 MIT —
ps file MIT —
ps file
|
 NGS —
ps file NGS —
ps file
|
 NGS —
ps file NGS —
ps file
|
 NGS —
ps file NGS —
ps file
|
 PDR —
ps file PDR —
ps file
|
 PDR —
ps file PDR —
ps file
|
 PDR —
ps file PDR —
ps file
|
 SIO —
ps file SIO —
ps file
|
 SIO —
ps file SIO —
ps file
|
 SIO —
ps file SIO —
ps file
|
 ULR —
ps file ULR —
ps file
|
 ULR —
ps file ULR —
ps file
|
 ULR —
ps file ULR —
ps file
|
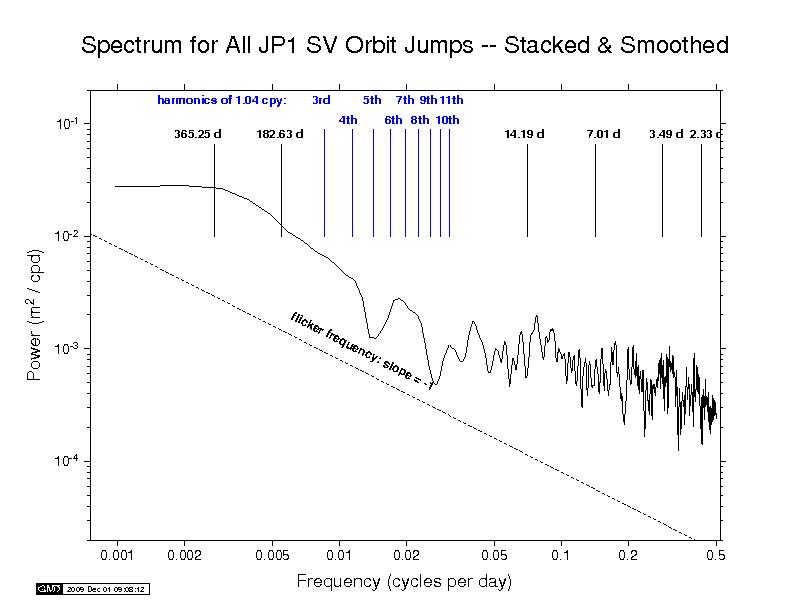
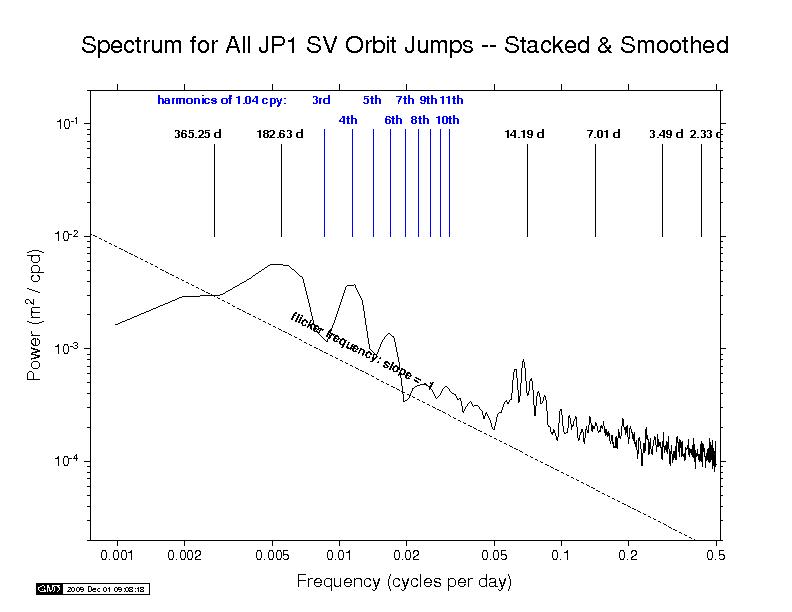
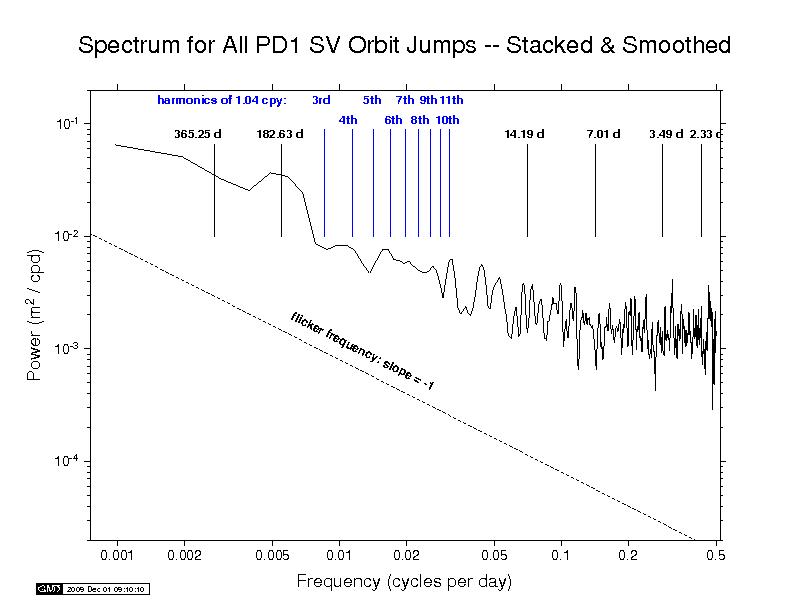
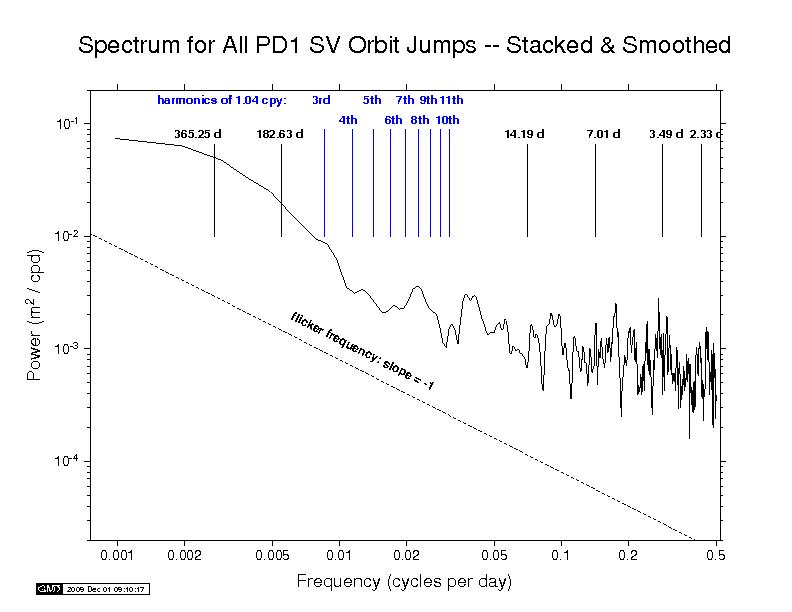
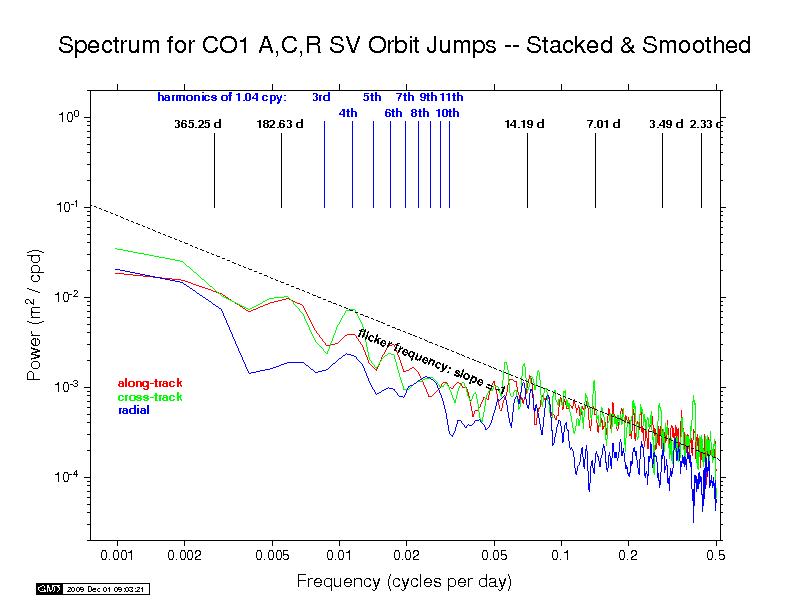
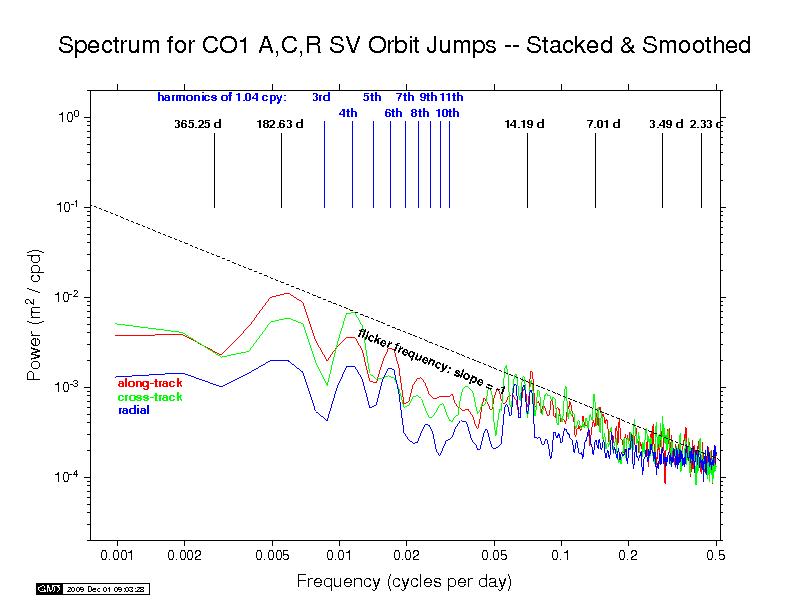
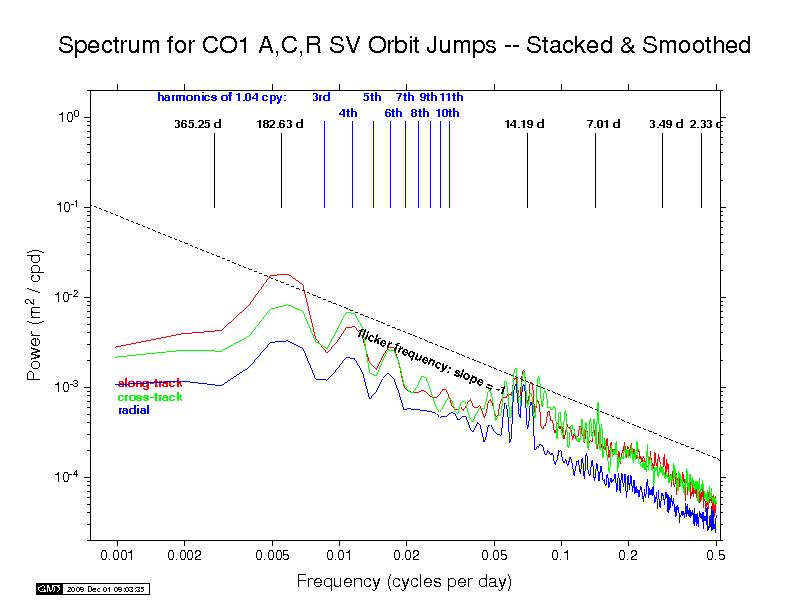
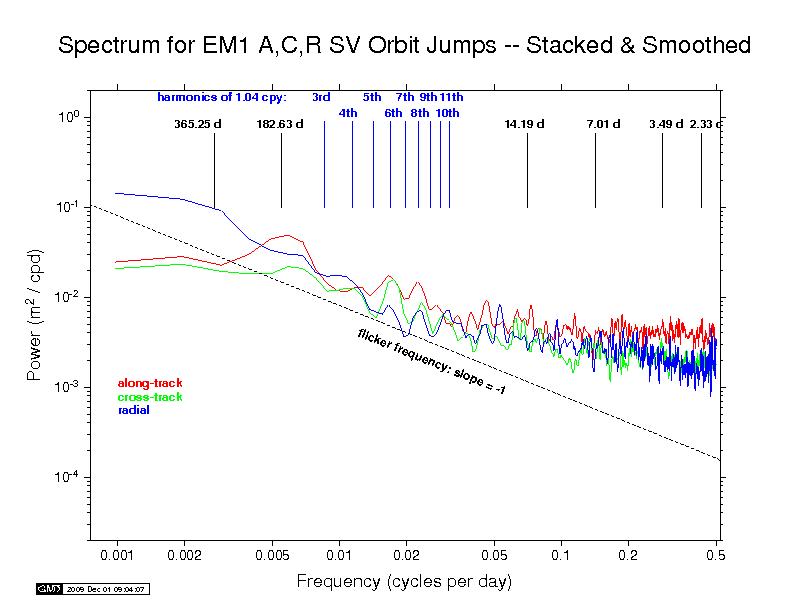
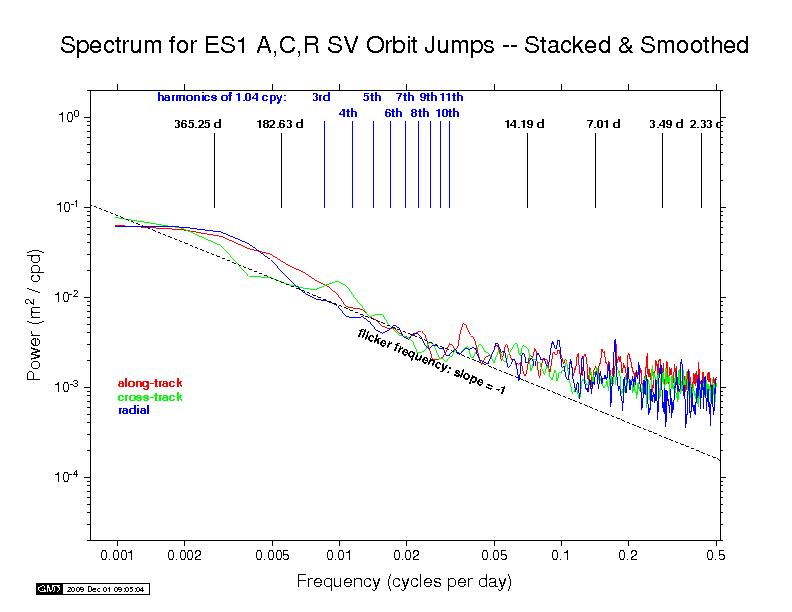
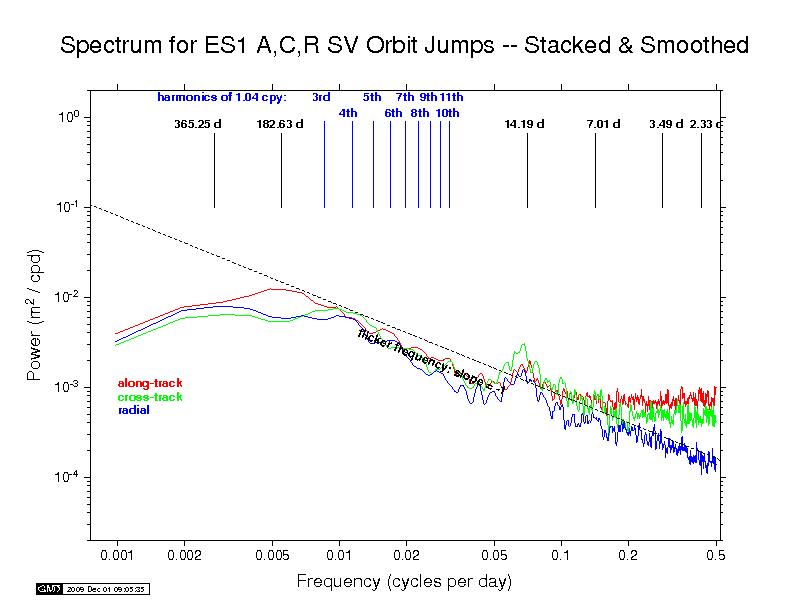
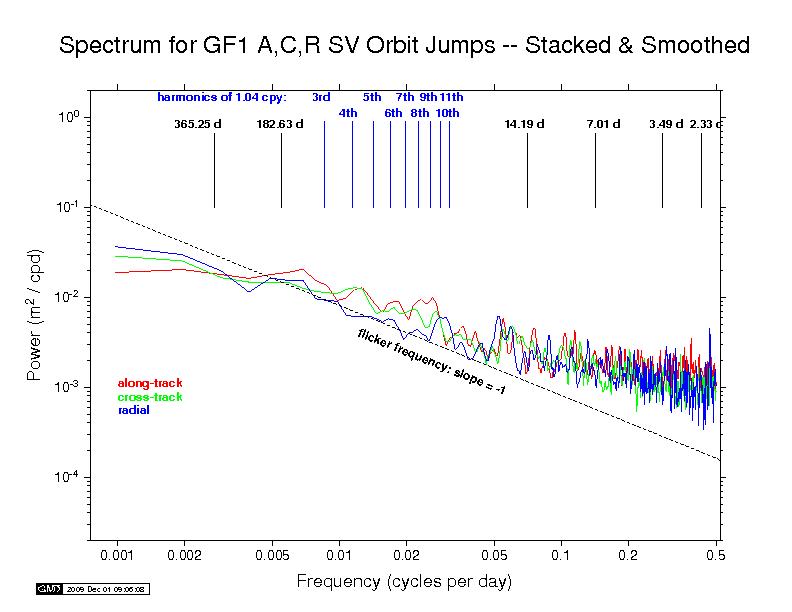
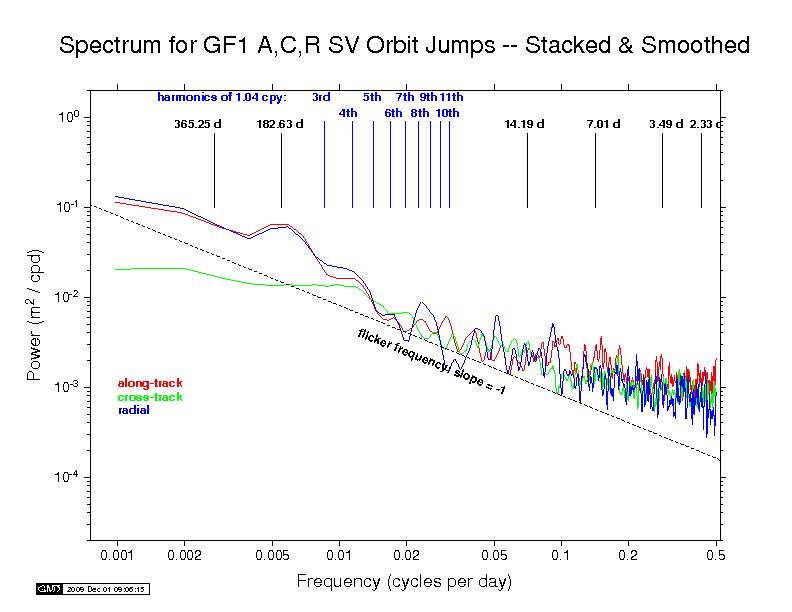
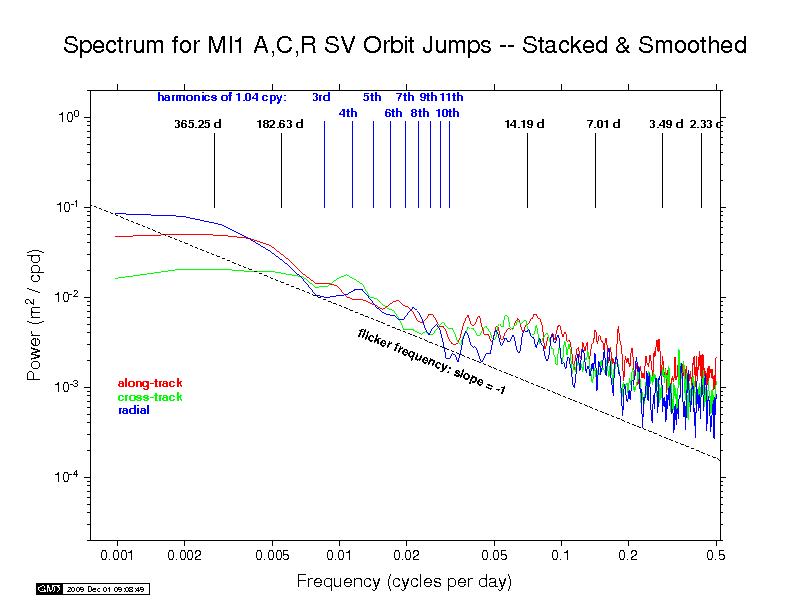
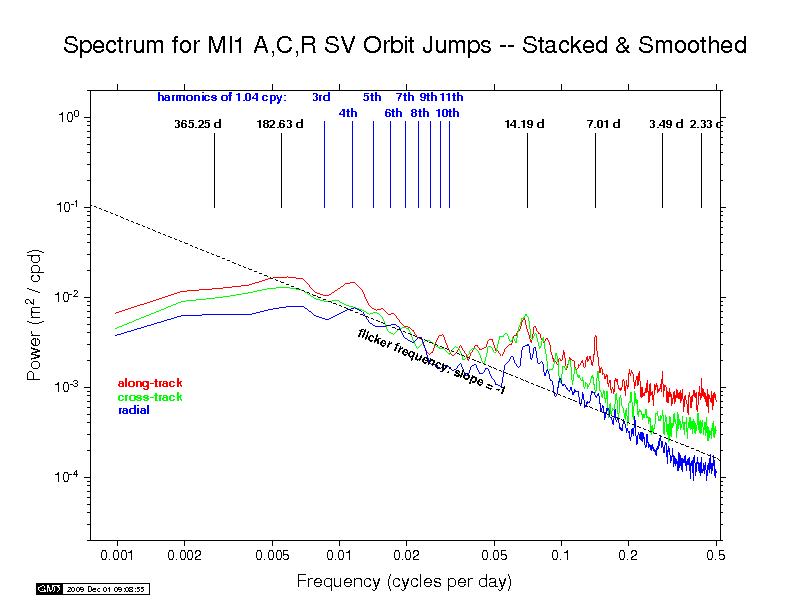
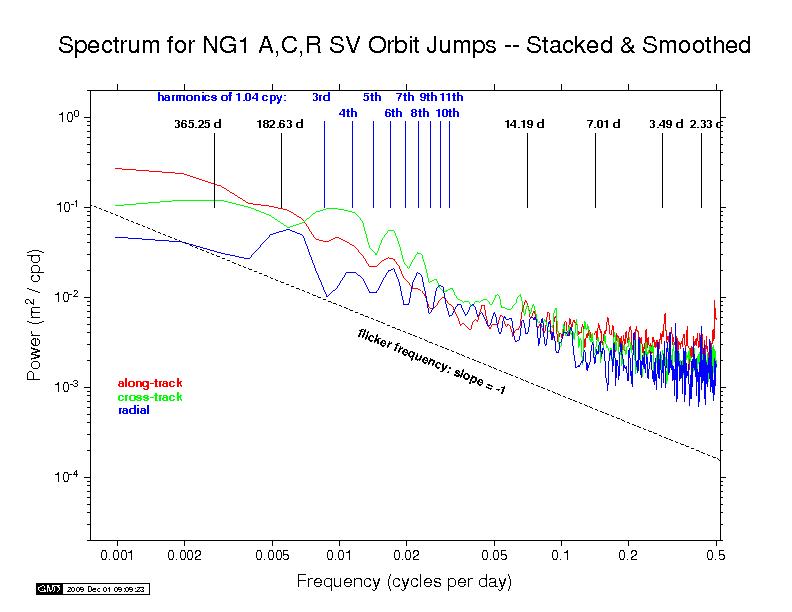
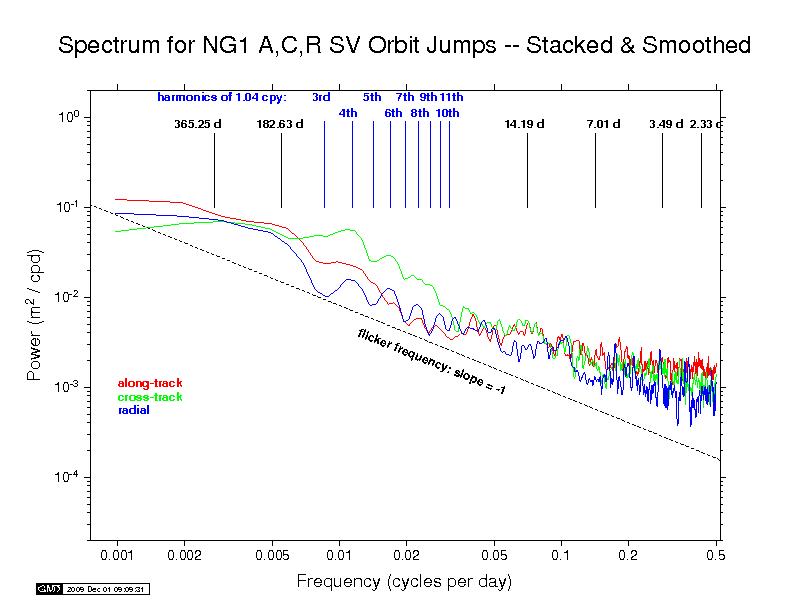
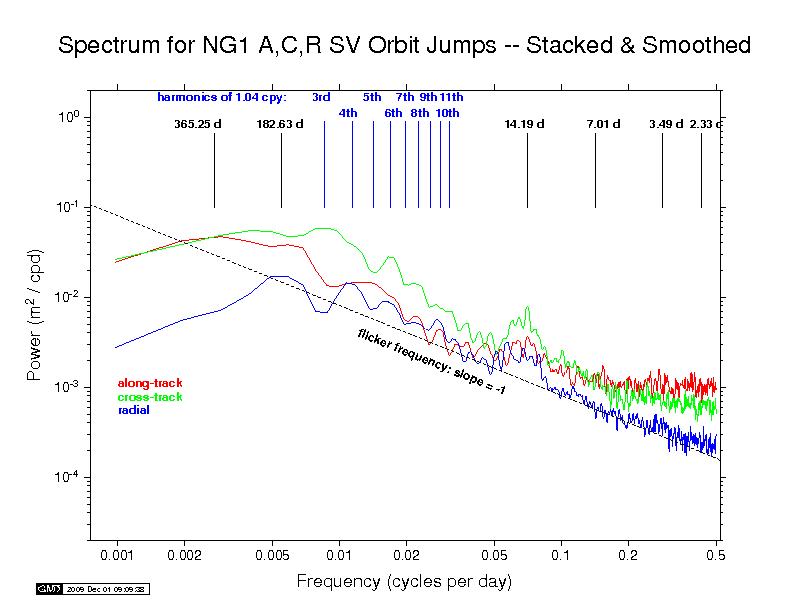
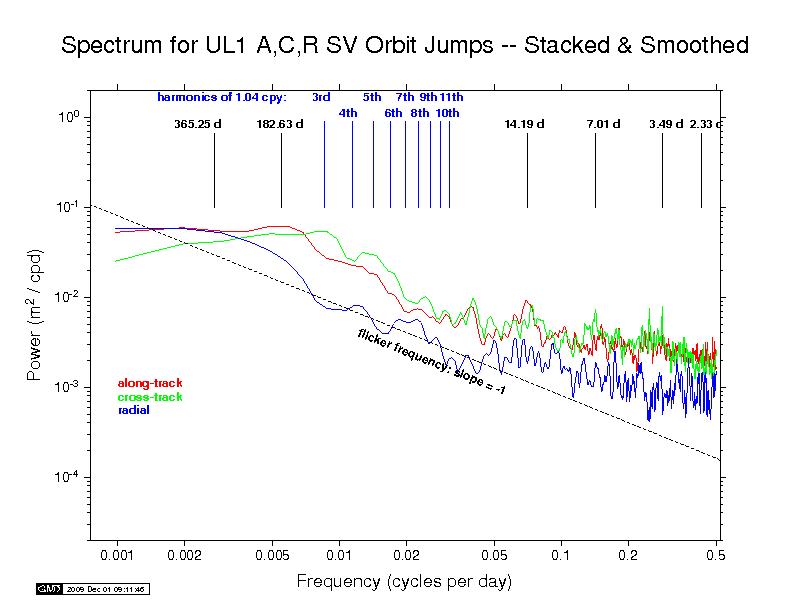
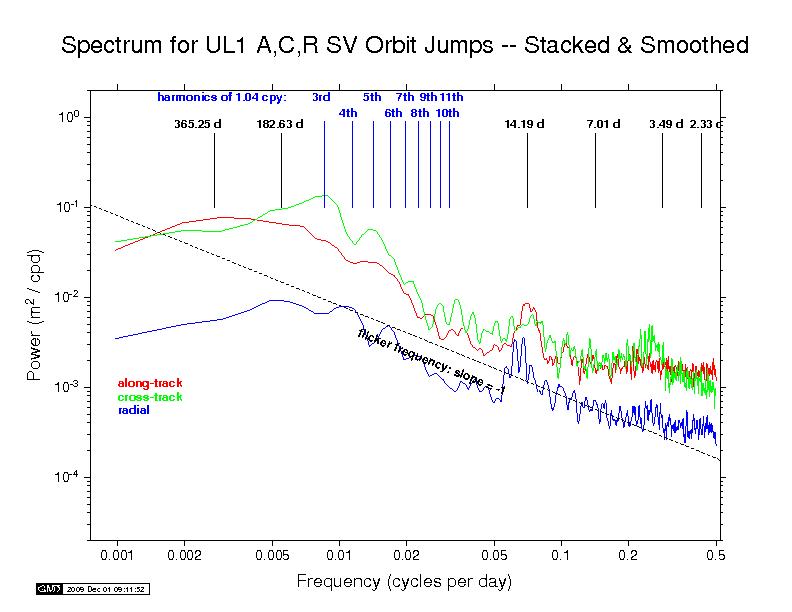
Our analysis reveals highly varied orbit behaviors, but most AC spectra generally follow a flicker phase power-law trend (slope -1) from the longest periods down to about monthly periods. This flicker phase characteristic of the IGS orbits probably has much to do with the long-appreciated temporal correlations in GPS station position time series (e.g., Williams et al., J. Geophys. Res., 109(B03412), doi: 10.1029/2003JB002741, 2004). Several spectra show superposed broadly distributed semi-annual power, which is probably related mostly to satellite eclipse seasons, while diffuse fortnightly bands are also common to most ACs. The latter could possibly be linked to a range of tidal modeling or perhaps nutation errors. In addition, we have marked several harmonics of the GPS draconitic year (1.040 cpy), of which the even multiples appear to be present with varying amplitudes in most spectra. For a summary of the AC spectral features, see the table at bottom below.
Recall that the point of comparison between the successive daily orbital arcs is at the fixed epoch 23:52:30 (GPS time), 7.5 minutes after the end of one SP3 file and 7.5 minutes before the next. As the orbit differences advance in 1-day steps, this comparison point moves around the GPS ellipse about 1 degree per day. A full circuit is completed in the 351.4 d of the GPS draconitic year due to the slow precession of the orbit plane because of the Earth's oblateness. During this time, two eclipse seasons are encountered for each GPS orbit plane. It is the beating of these two cycles that probably explains the appearance of the even 1.040 cpy harmonics in nearly all the spectra.
High-frequency white noise floors can be detected in most AC orbit spectra. In
the recent years, a minimum asymptotic sigma of ~10 mm can be detected for PDR.
ESA and MIT have slightly higher high-frequency scatters of ~14 mm while
the remaining ACs are somewhat higher still. In the earlier years, a minimum
asymptotic sigma of ~14 mm can be detected for COD. All other ACs have significantly
higher high-frequency scatters. It is important to note, however, that the orbit
discontinuity scatters for COD and PDR are probably not fully comparable to most
other ACs because they use three 24-hr processing arcs (with constrained velocity breaks
introduced every 12 hr). This practice introduces correlations between the orbits of
successive days and attenuates the orbit discontinuities by an unknown amount.
A similar but smaller attenuating effect is seen in the spectra for JPL and GFZ.
JPL reports the middle-day values for each overlapping 30 hr (3 hr + 24 hr + 3 hr)
processing arc. GFZ uses three 24-hr processing arcs, like COD and PDR, but with
constrained velocity breaks only at midday. The remaining ACs use strictly 24 hr
of data for each daily orbit. (Note, though, that even with daily independent
orbit arcs, some level of correlation between days is expected due to the weekly
stacking of the station coordinates used by the IGS.)
The table below summarizes the features that can be observed in the spectral plots of the AC orbit discontinuites, above.
| Features in Spectra of AC Day-boundary Orbit Discontinuities | |||||||||||||||
| Center | annual | semi-annual | tidal/other bands | 1.040 cpy harmonics | Remarks | ||||||||||
| Seg 1 | Seg 2 | Seg 3 | Seg 1 | Seg 2 | Seg 3 | Seg 1 | Seg 2 | Seg 3 | Seg 1 | Seg 2 | Seg 3 | ||||
| COD | - | - | - | Y | Y | Y | 7 d band? | 14 d band, 7 d band, 4 d band? | 14 d band | 4th, 8th | 4th | 4th | 3 * 24 hr arc | ||
| EMR | - | - | - | Y | ? | Y | 14 d band, 7 d band | 14 d band, 7 d band?, 4 d band? | 14 d band4th, 6th, 11th | 4th, 7th, 10th | 4th, 6th, 8th, 10th | 24 hr arc | |||
| ESA | - | - | - | Y | ? | ? | 14 d band? | 14 d band?, 4 d band | 14 d band | 4th, 6th, 8th, 11th | 3rd, 8th | 4th? | 24 hr arc | ||
| GFZ | - | - | - | Y? | Y | Y? | 14 d band? | 14 d band? | 14 d band | 4th, 6th, 8th, 10th | 4th, 6th, 8th, 9th? | 4th?, 7th, 8th? | 3 * 24 hr arc | ||
| JPL | N/A | - | - | N/A | Y? | Y | N/A | 14d band, 4 d band | 14d band | N/A | 4th?, 7th, 8th, 11th | 4th, 6th | 3 + 24 + 3 hr arc | ||
| MIT | - | - | - | Y | ? | Y | 14 d band, 4 d band? | 14 d band?, 4 d band | 14 d band, 7 d band? | 4th?, 6th, 7th, 8th, 10th | 8th, 10th? | 4th | 24 hr arc | ||
| NGS | - | - | - | Y | Y | ? | 14 d band, 7 d band, 4 d band? | 14 d band, 4 d band | 14 d band | 4th, 6th, 8th, 10th | 4th, 6th, 8th | 4th, 6th, 8th | 24 hr arc | ||
| PDR | - | - | - | Y | ? | Y | 14 d band | 14 d band, 7 d band?, 4 d band | 14 d band, 7 d band? | 4th, 6th, 10th | 3rd, 8th, 10th? | 4th | 3 * 24 hr arc | ||
| SIO | - | - | - | Y | Y | Y | 14 d band, 7 d band? | 14 d band, 7 d band?, 4 d band? | 14 d band, 7 d band? | 4th?, 6th?, 8th? | 4th, 6th, 8th | 4th, 8th? | 24 hr arc | ||
| ULR | - | - | - | ? | ? | Y | ? | 4 d band | 14 d band, 4 d band? | 3rd, 5th, 8th, 10th, 11th | 3rd, 5th, 8th, 10th | 3rd, 6th, 8th | 24 hr arc | ||
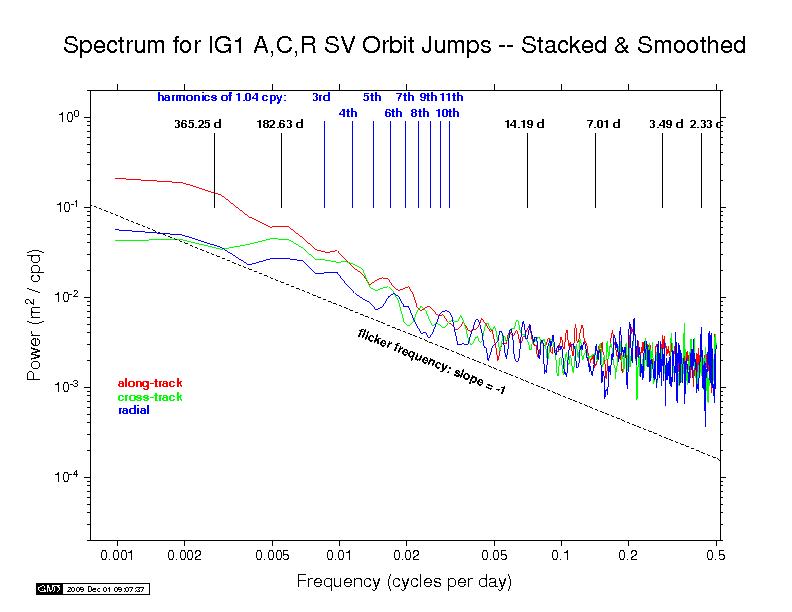
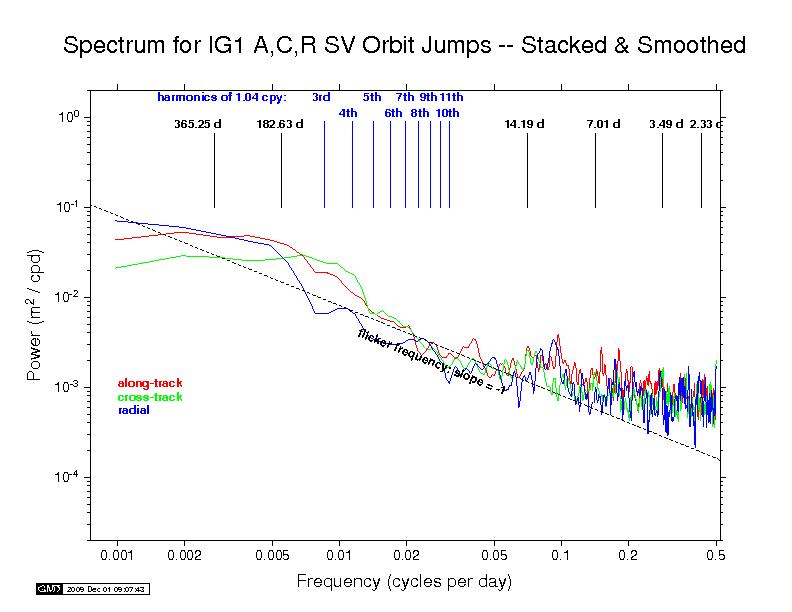
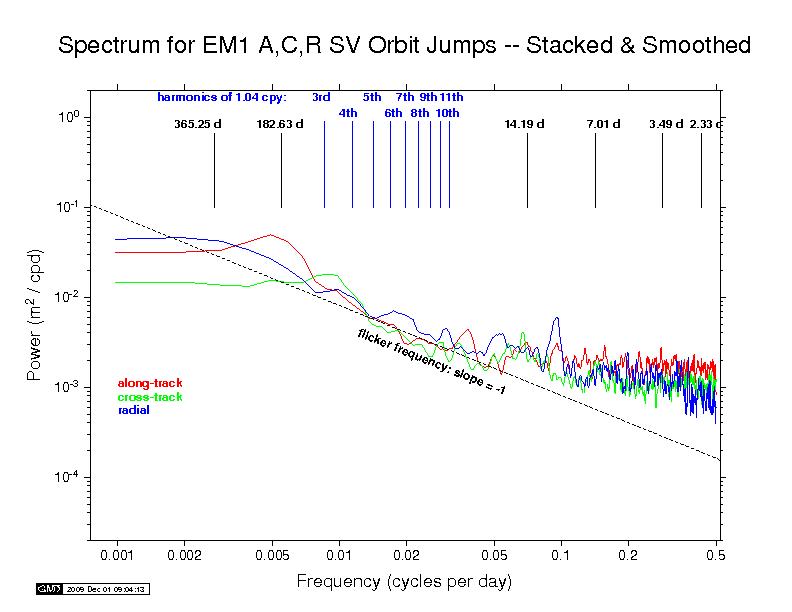
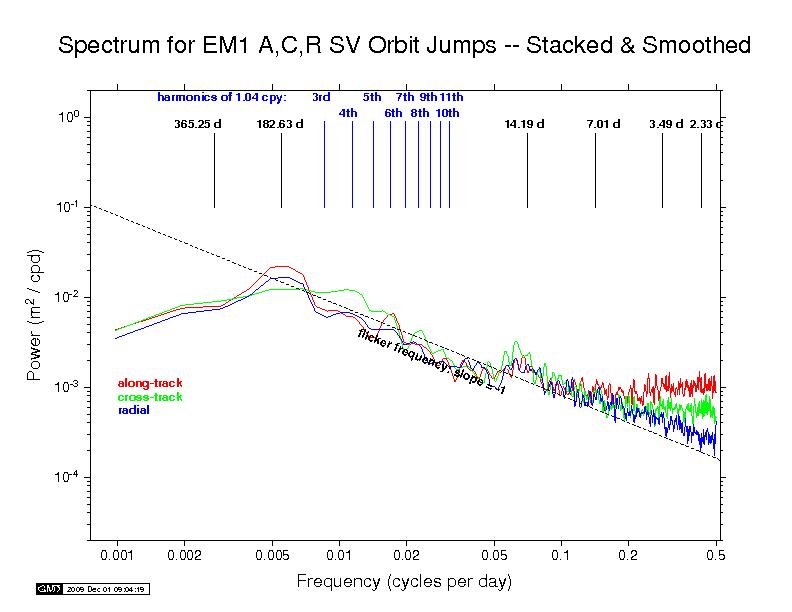
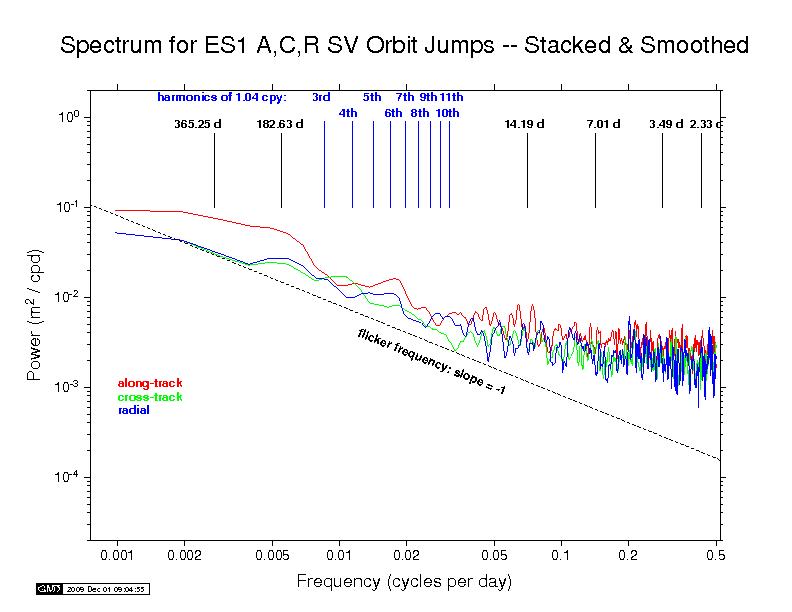
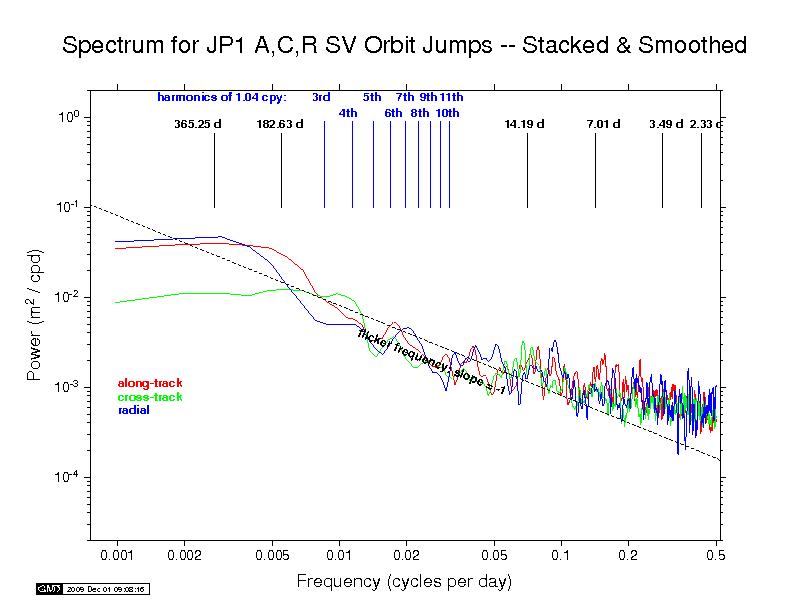
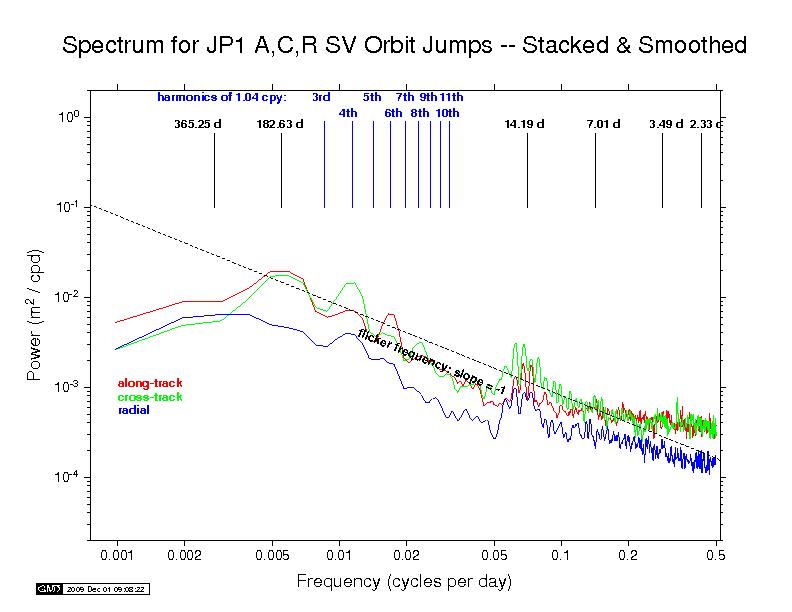
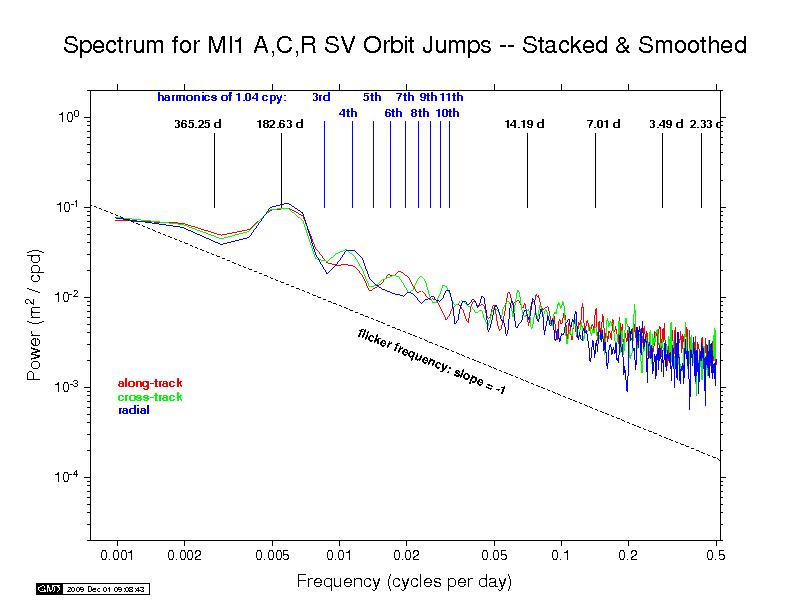
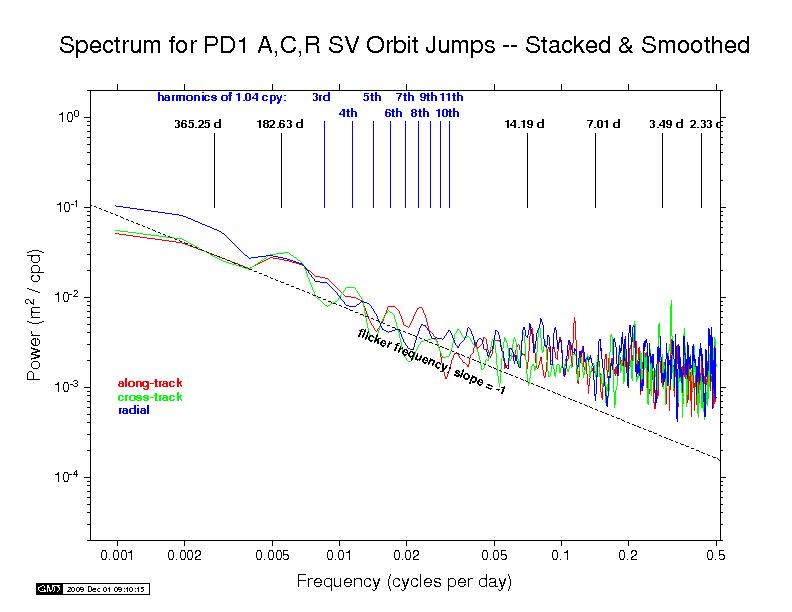
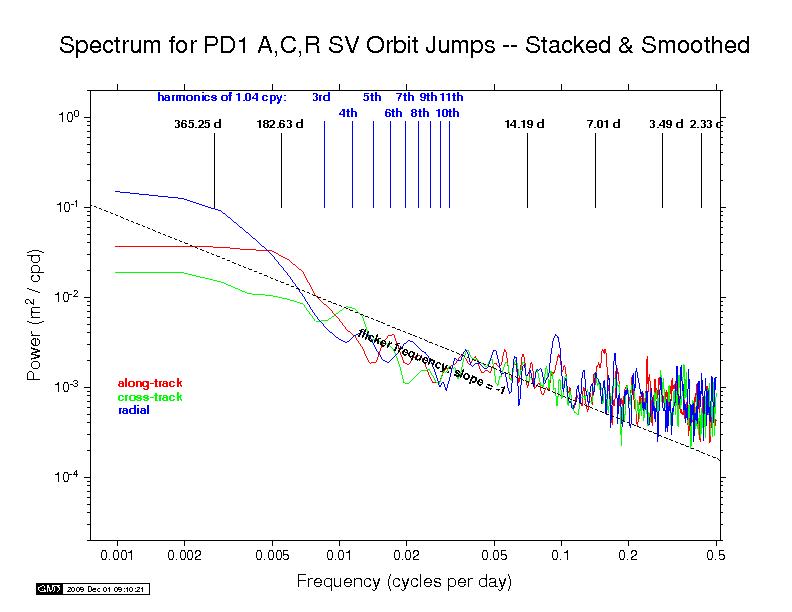
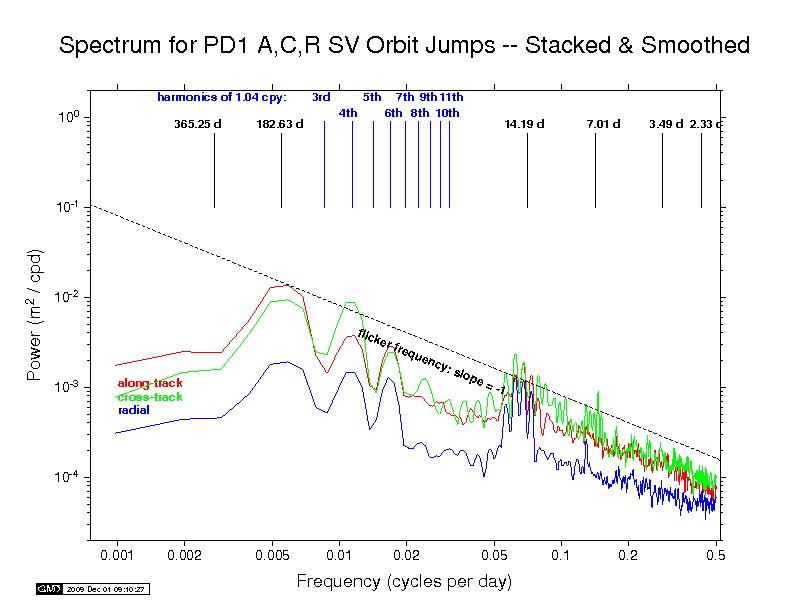
To better understand the results above, power spectra have been
computed for the along-track, cross-track and radial components of the
orbit jumps.
|
Seg 1: Aug 01, 1999 through May 21, 2002
|
Seg 2: May 22, 2002 through Mar 11, 2005
|
Seg 3: Mar 12, 2005 through Dec 31, 2007
|
 IGS —
ps file IGS —
ps file
|
 IGS —
ps file IGS —
ps file
|
 IGS —
ps file IGS —
ps file
|
|
|
||
 COD —
ps file COD —
ps file
|
 COD —
ps file COD —
ps file
|
 COD —
ps file COD —
ps file
|
 EMR —
ps file EMR —
ps file
|
 EMR —
ps file EMR —
ps file
|
 EMR —
ps file EMR —
ps file
|
 ESA —
ps file ESA —
ps file
|
 ESA —
ps file ESA —
ps file
|
 ESA —
ps file ESA —
ps file
|
 GFZ —
ps file GFZ —
ps file
|
 GFZ —
ps file GFZ —
ps file
|
 GFZ —
ps file GFZ —
ps file
|
|
N/A JPL —
ps file
|
 JPL —
ps file JPL —
ps file
|
 JPL —
ps file JPL —
ps file
|
 MIT —
ps file MIT —
ps file
|
 MIT —
ps file MIT —
ps file
|
 MIT —
ps file MIT —
ps file
|
 NGS —
ps file NGS —
ps file
|
 NGS —
ps file NGS —
ps file
|
 NGS —
ps file NGS —
ps file
|
 PDR —
ps file PDR —
ps file
|
 PDR —
ps file PDR —
ps file
|
 PDR —
ps file PDR —
ps file
|
 SIO —
ps file SIO —
ps file
|
 SIO —
ps file SIO —
ps file
|
 SIO —
ps file SIO —
ps file
|
 ULR —
ps file ULR —
ps file
|
 ULR —
ps file ULR —
ps file
|
 ULR —
ps file ULR —
ps file
|
| Send comments to Jake Griffiths | (updated 24 Nov 2009) |