 |
|
|
| |
|
|
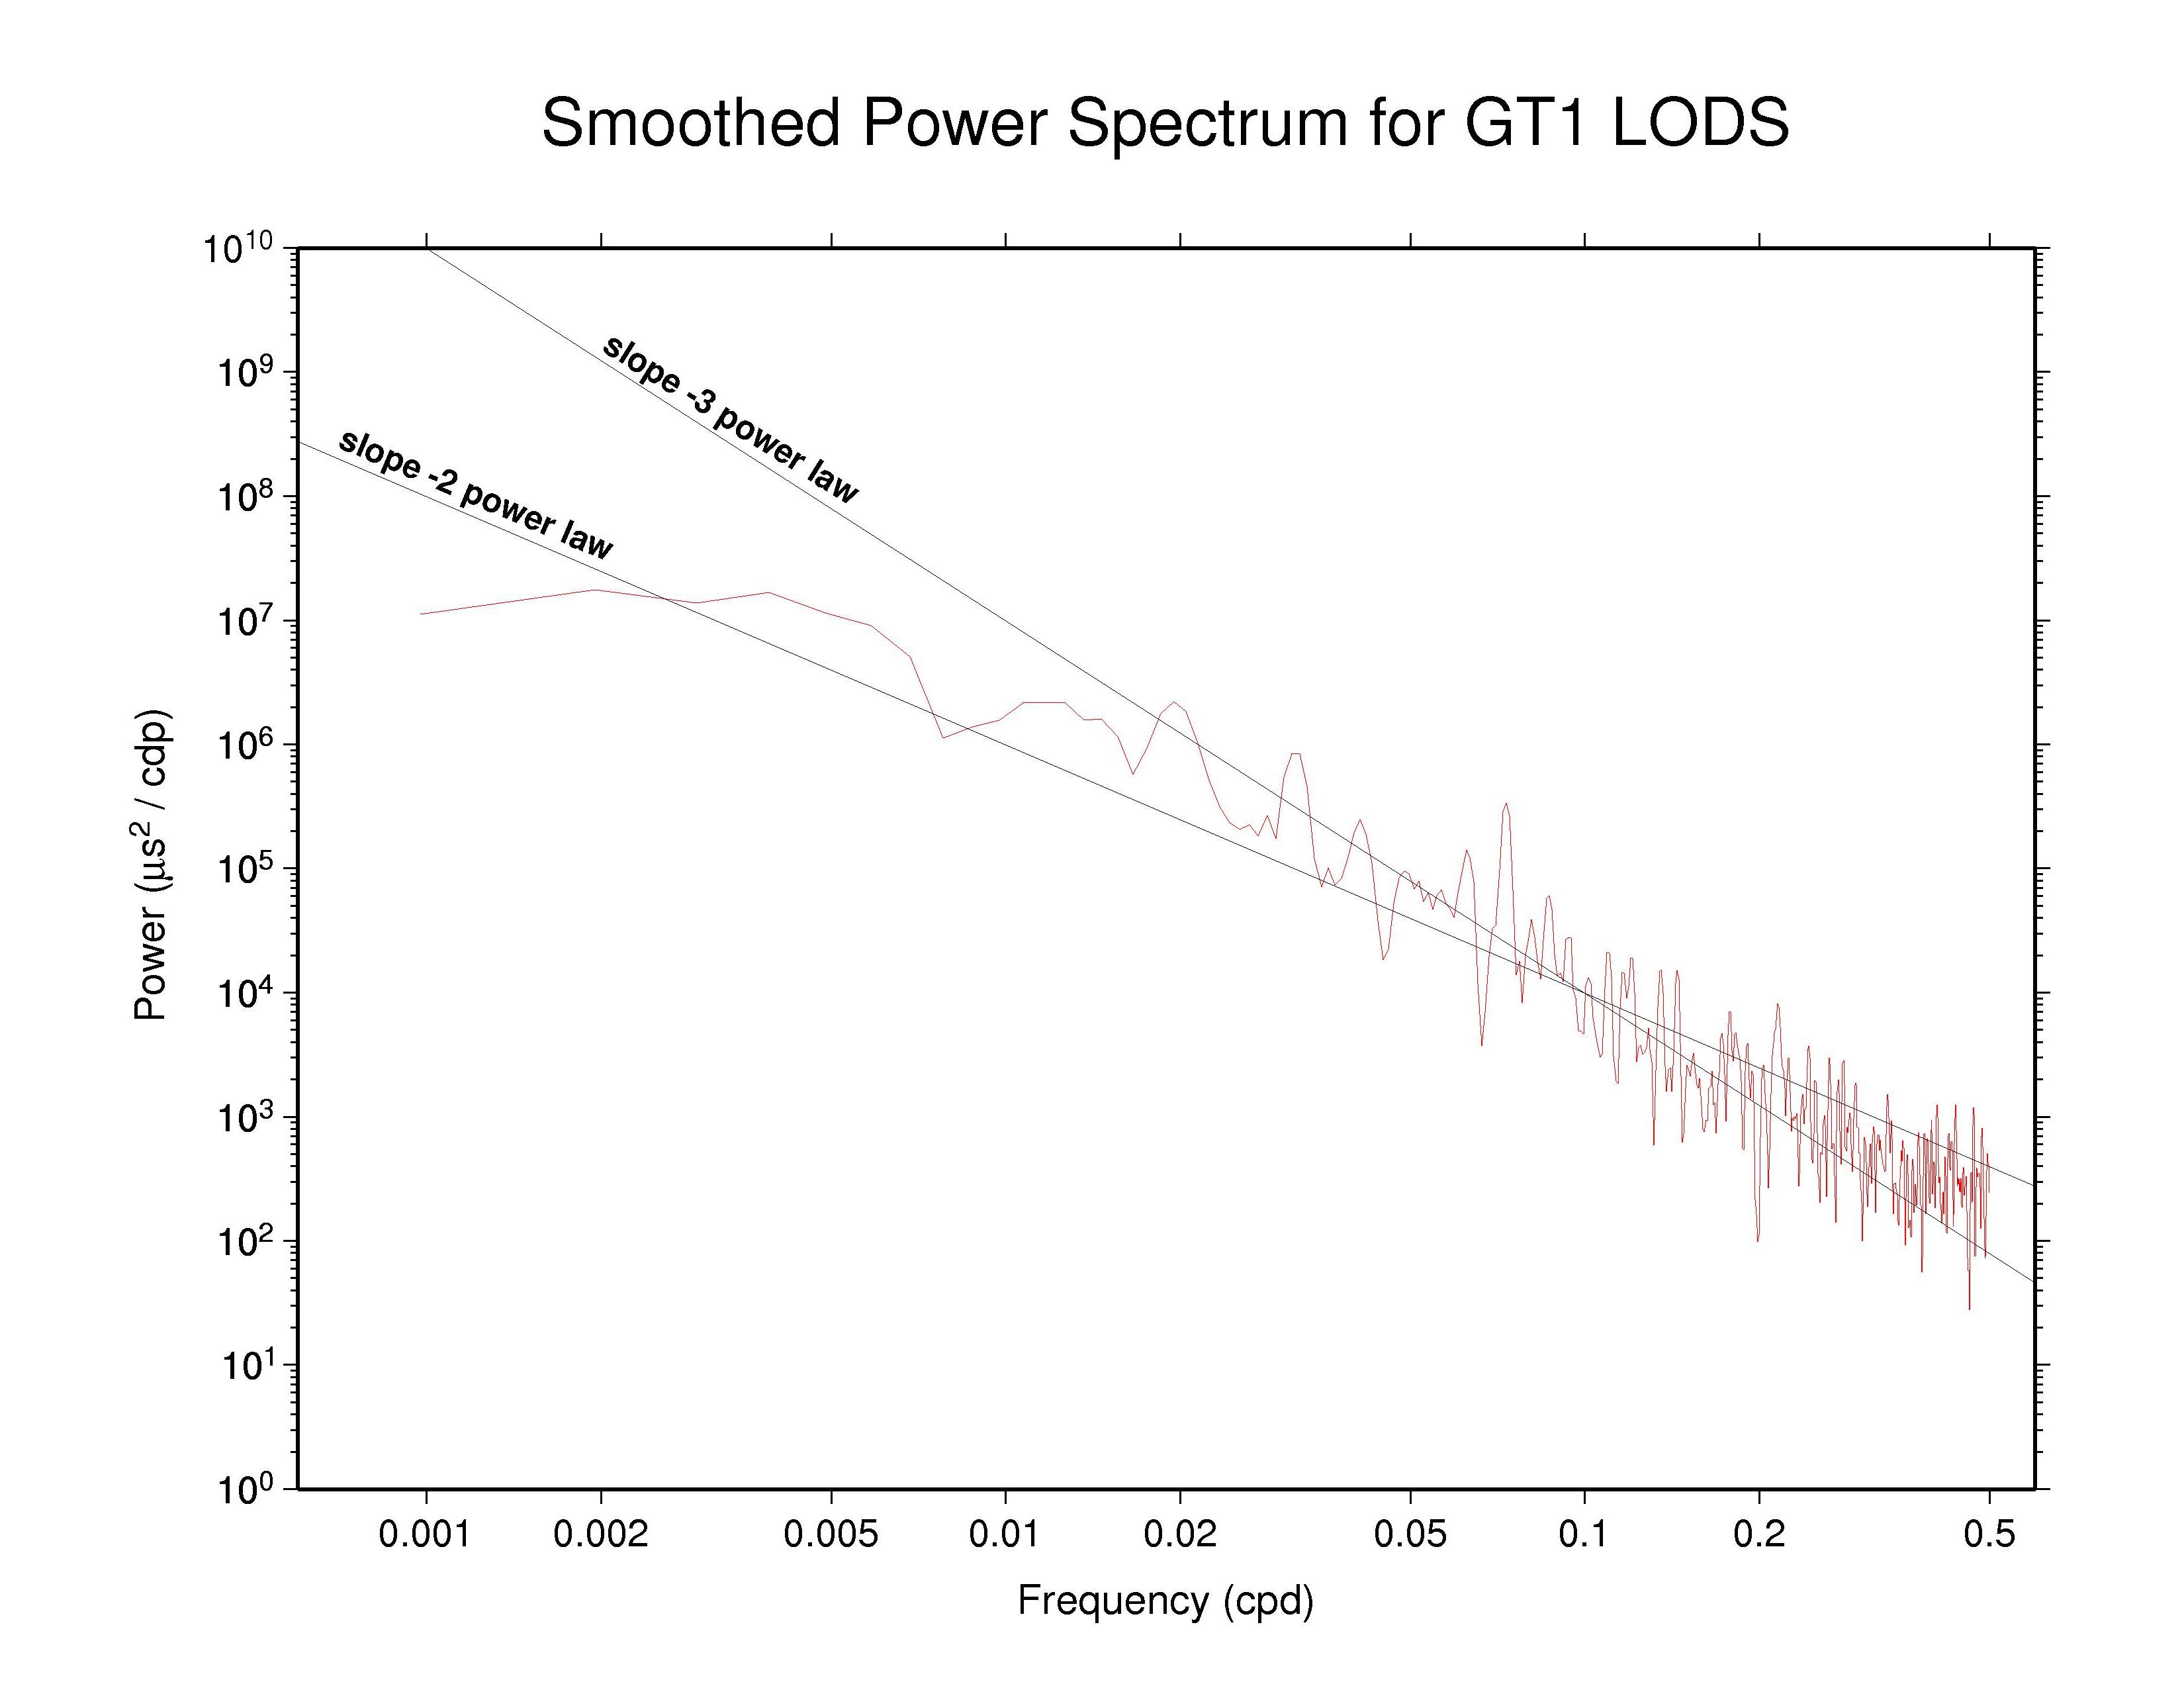
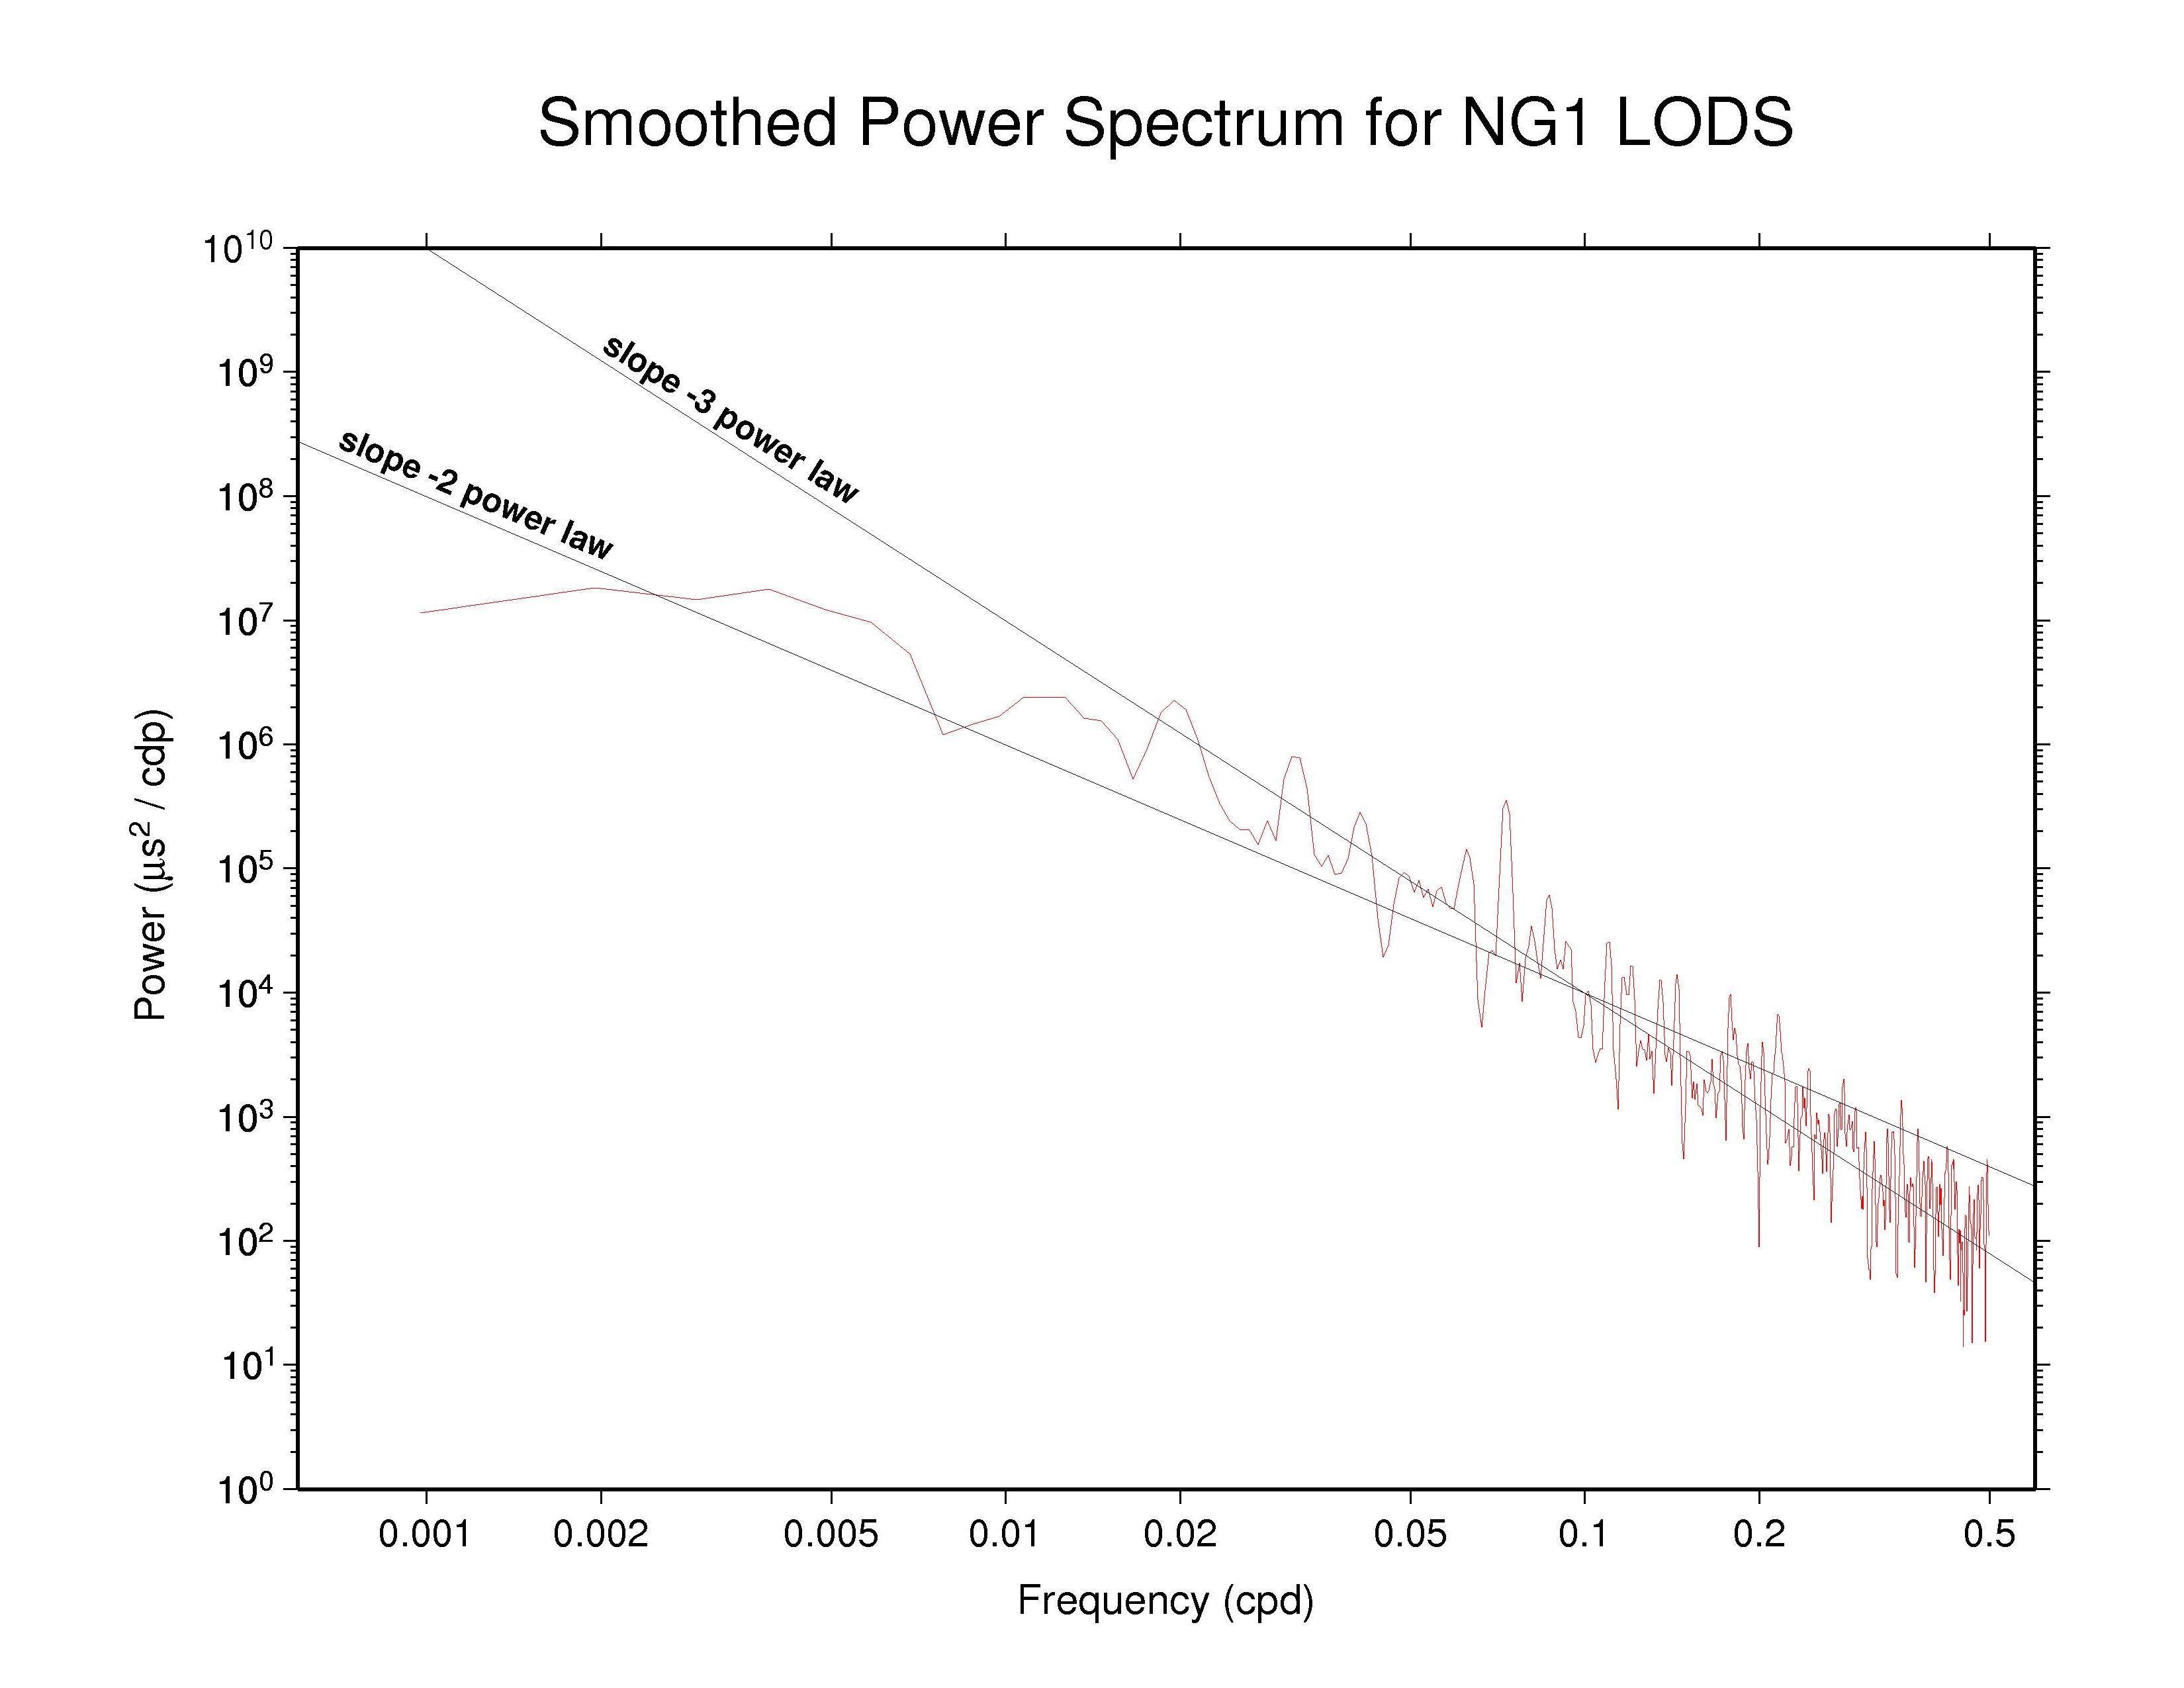
Power spectra have been generated and are plotted below for the length of day (LOD) time series of each Analysis Center (AC) participating in the IGS Reprocessing Campaign #1 (repro1), as well as for the IGS combination. Matching sites to this one look at the associated polar motion and orbit discontinuity time series. The 1024 days (or 1025 days for differences) through week 1459 (end of 2007) have been used to obtain consistent, comparable, and modern results from all ACs. This span covers epochs from MJD 53440.5 (or 53439.5 for LOD differences) through 54463.5, which corresponds to the period 11 (or 10) Mar 2005 (week 1313_5) through 29 Dec 2007 (week 1459_6). LOD values have been extracted from the reported weekly ERP files and assume that the ERP estimates are freely estimated without any constraints. In the case when the associated SINEX ERP values are actually reported with non-trivial constraints, the effect of those constraints (which are removed in the official SINEX combination) is not accounted for here. This consideration applies in particular to the PDR ERP values. Note that for those ACs reporting 9 ERP values each week, the 7 unique middle values have been used here.
Tidal variations in the Earth's rotation angle (UT1) and rate (LOD) are large and must ordinarily be removed a priori (or at least greatly attenuated) using a model. The IERS Conventions 2003 recommend that the tidal deformations for an Earth model with a decoupled core and an anelastic mantle be computed using the zonal tide model of Defraigne and Smits (1999). Oceanic contributions have been included by them assuming an equilibrium ocean tide model. The specific routine used here is the coding by the IERS EOP Product Center, based at the Paris Observatory, which is available at tver2000.f. The largest sub-annual tidal lines (in decreasing amplitude order) have periods of 182.62 d, 365.26 d, 13.66/13.63 d, 27.56 d, 31.81 d, 121.75 d, 177.84 d, and 9.13 d. After correction for the zonal tides in this way, UT1 and LOD are denoted as UT1S and LODS, respectively.
For the displays below a smoothing across each three adjacent frequencies has been applied with a sliding boxcar filter to make the appearance less noisy (but unsmoothed plots are also available and are not substantially different).
Most continuous geophysical processes and most physical noise process
possess power spectra that decrease as the frequency raised to some
characteristic negative power ("spectral index"). The spectra are usually
"reddish" in the sense of having more power at the lower frequencies
(i.e., longer periods). For reference, a power law with spectral index
of -2 is drawn on each plot (not a fit). This corresponds to the
behavior of a random walk noise process. Since some steepening of the
LODS power slope is seen at higher frequencies in most cases, a power
law with spectral index -3 is also drawn on each plot for comparison.
  IGS —
ps file IGS —
ps file
|
 CODE —
ps file CODE —
ps file
|
 EMR —
ps file EMR —
ps file
|
 ESA —
ps file ESA —
ps file
|
 GFZ —
ps file GFZ —
ps file
|
 GTZ —
ps file GTZ —
ps file
|
 JPL —
ps file JPL —
ps file
|
 MIT —
ps file MIT —
ps file
|
 NGS —
ps file NGS —
ps file
|
 PDR —
ps file PDR —
ps file
|
 SIO —
ps file SIO —
ps file
|
 ULR —
ps file ULR —
ps file
|
In all cases above, there seems to be evidence for residual power near
the important 13.66/13.63 d tidal lines (frequencies of 0.0732 and 0.0734
cpd respectively), which could occur if the zonal tide model is imperfect.
Most of the remaining power roughly follows a slope -2 power law (random
walk) for intervals longer than fortnightly, then steepens to a slope -3
(flicker frequency), and finally flattens in some cases or becomes
somewhat erratic at frequencies approaching the Nyquist limit of 0.5 cpd.
Significant deviations from this pattern are seen in the higher-frequency
behavior of EMR and to a lesser extent some of the other ACs. This could
be an effect of LOD biases due to coupling with the orbit modeling. None
of the LOD spectra here shows clear signs of the high-frequency
smoothing/filtering effect that would be caused by imposing a strict
day-to-day continuity condition on the LOD estimates, unless the power
law steepening from slope -2 to -3 is such an indication.
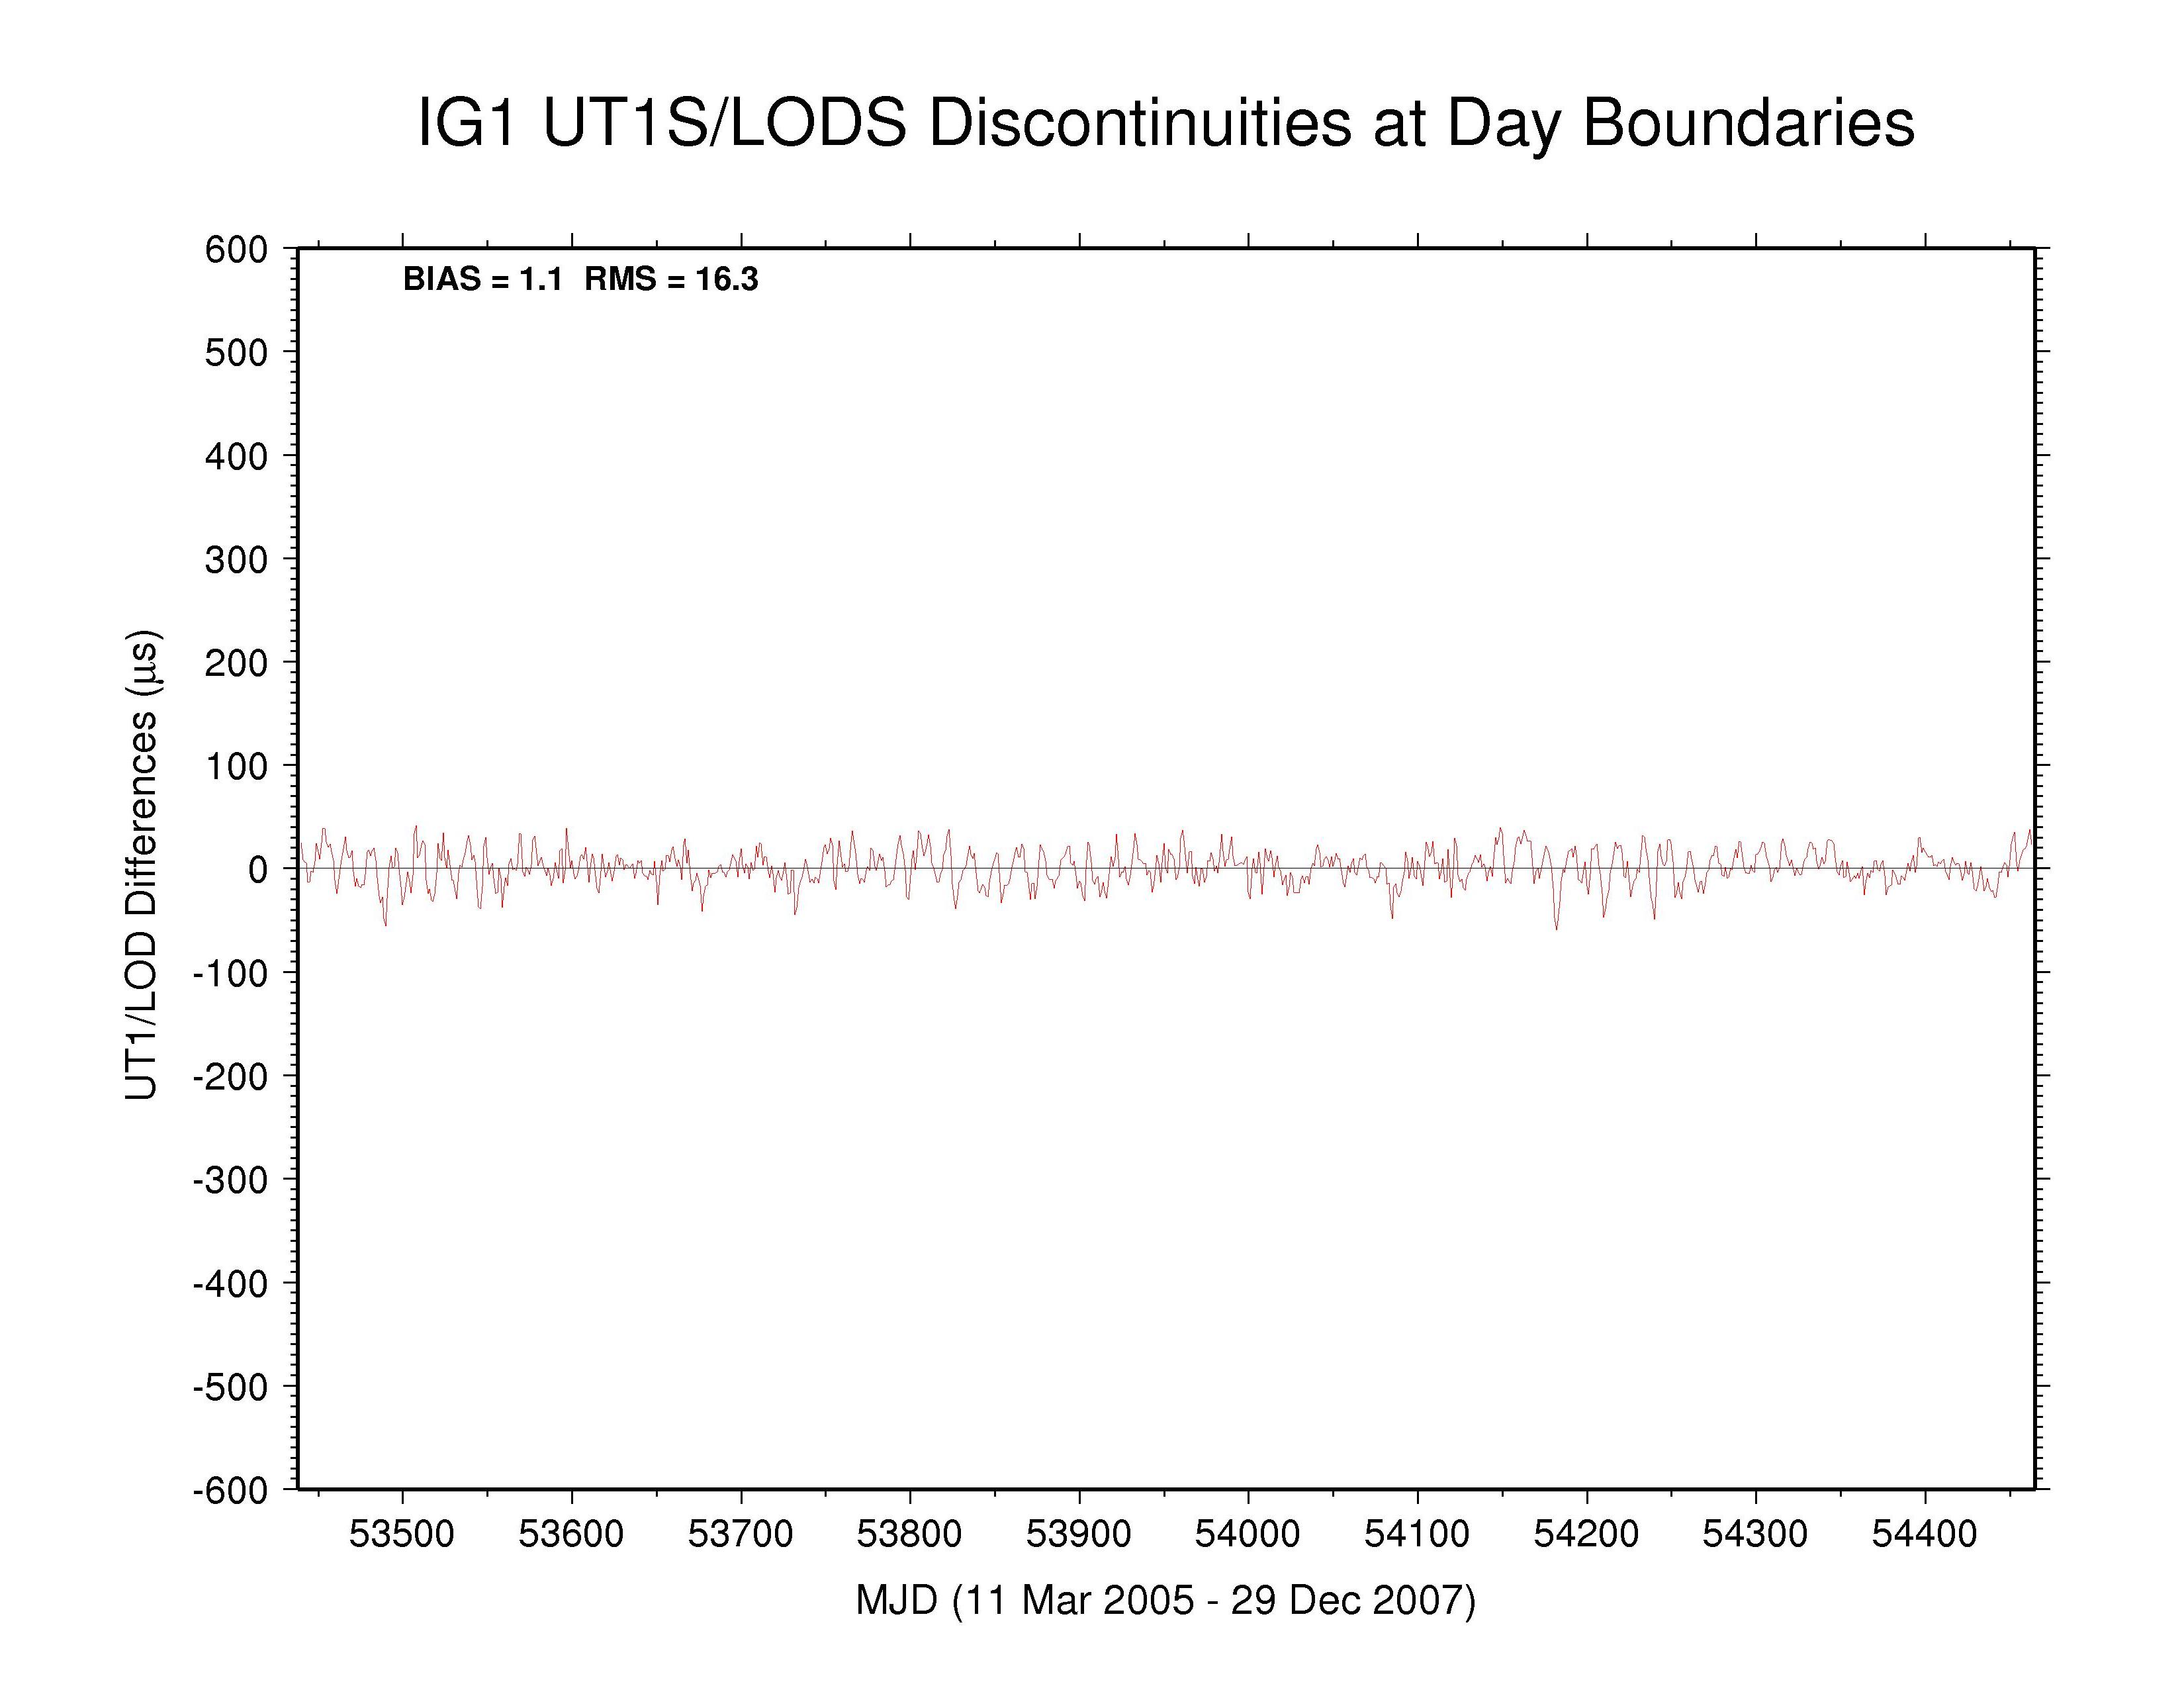
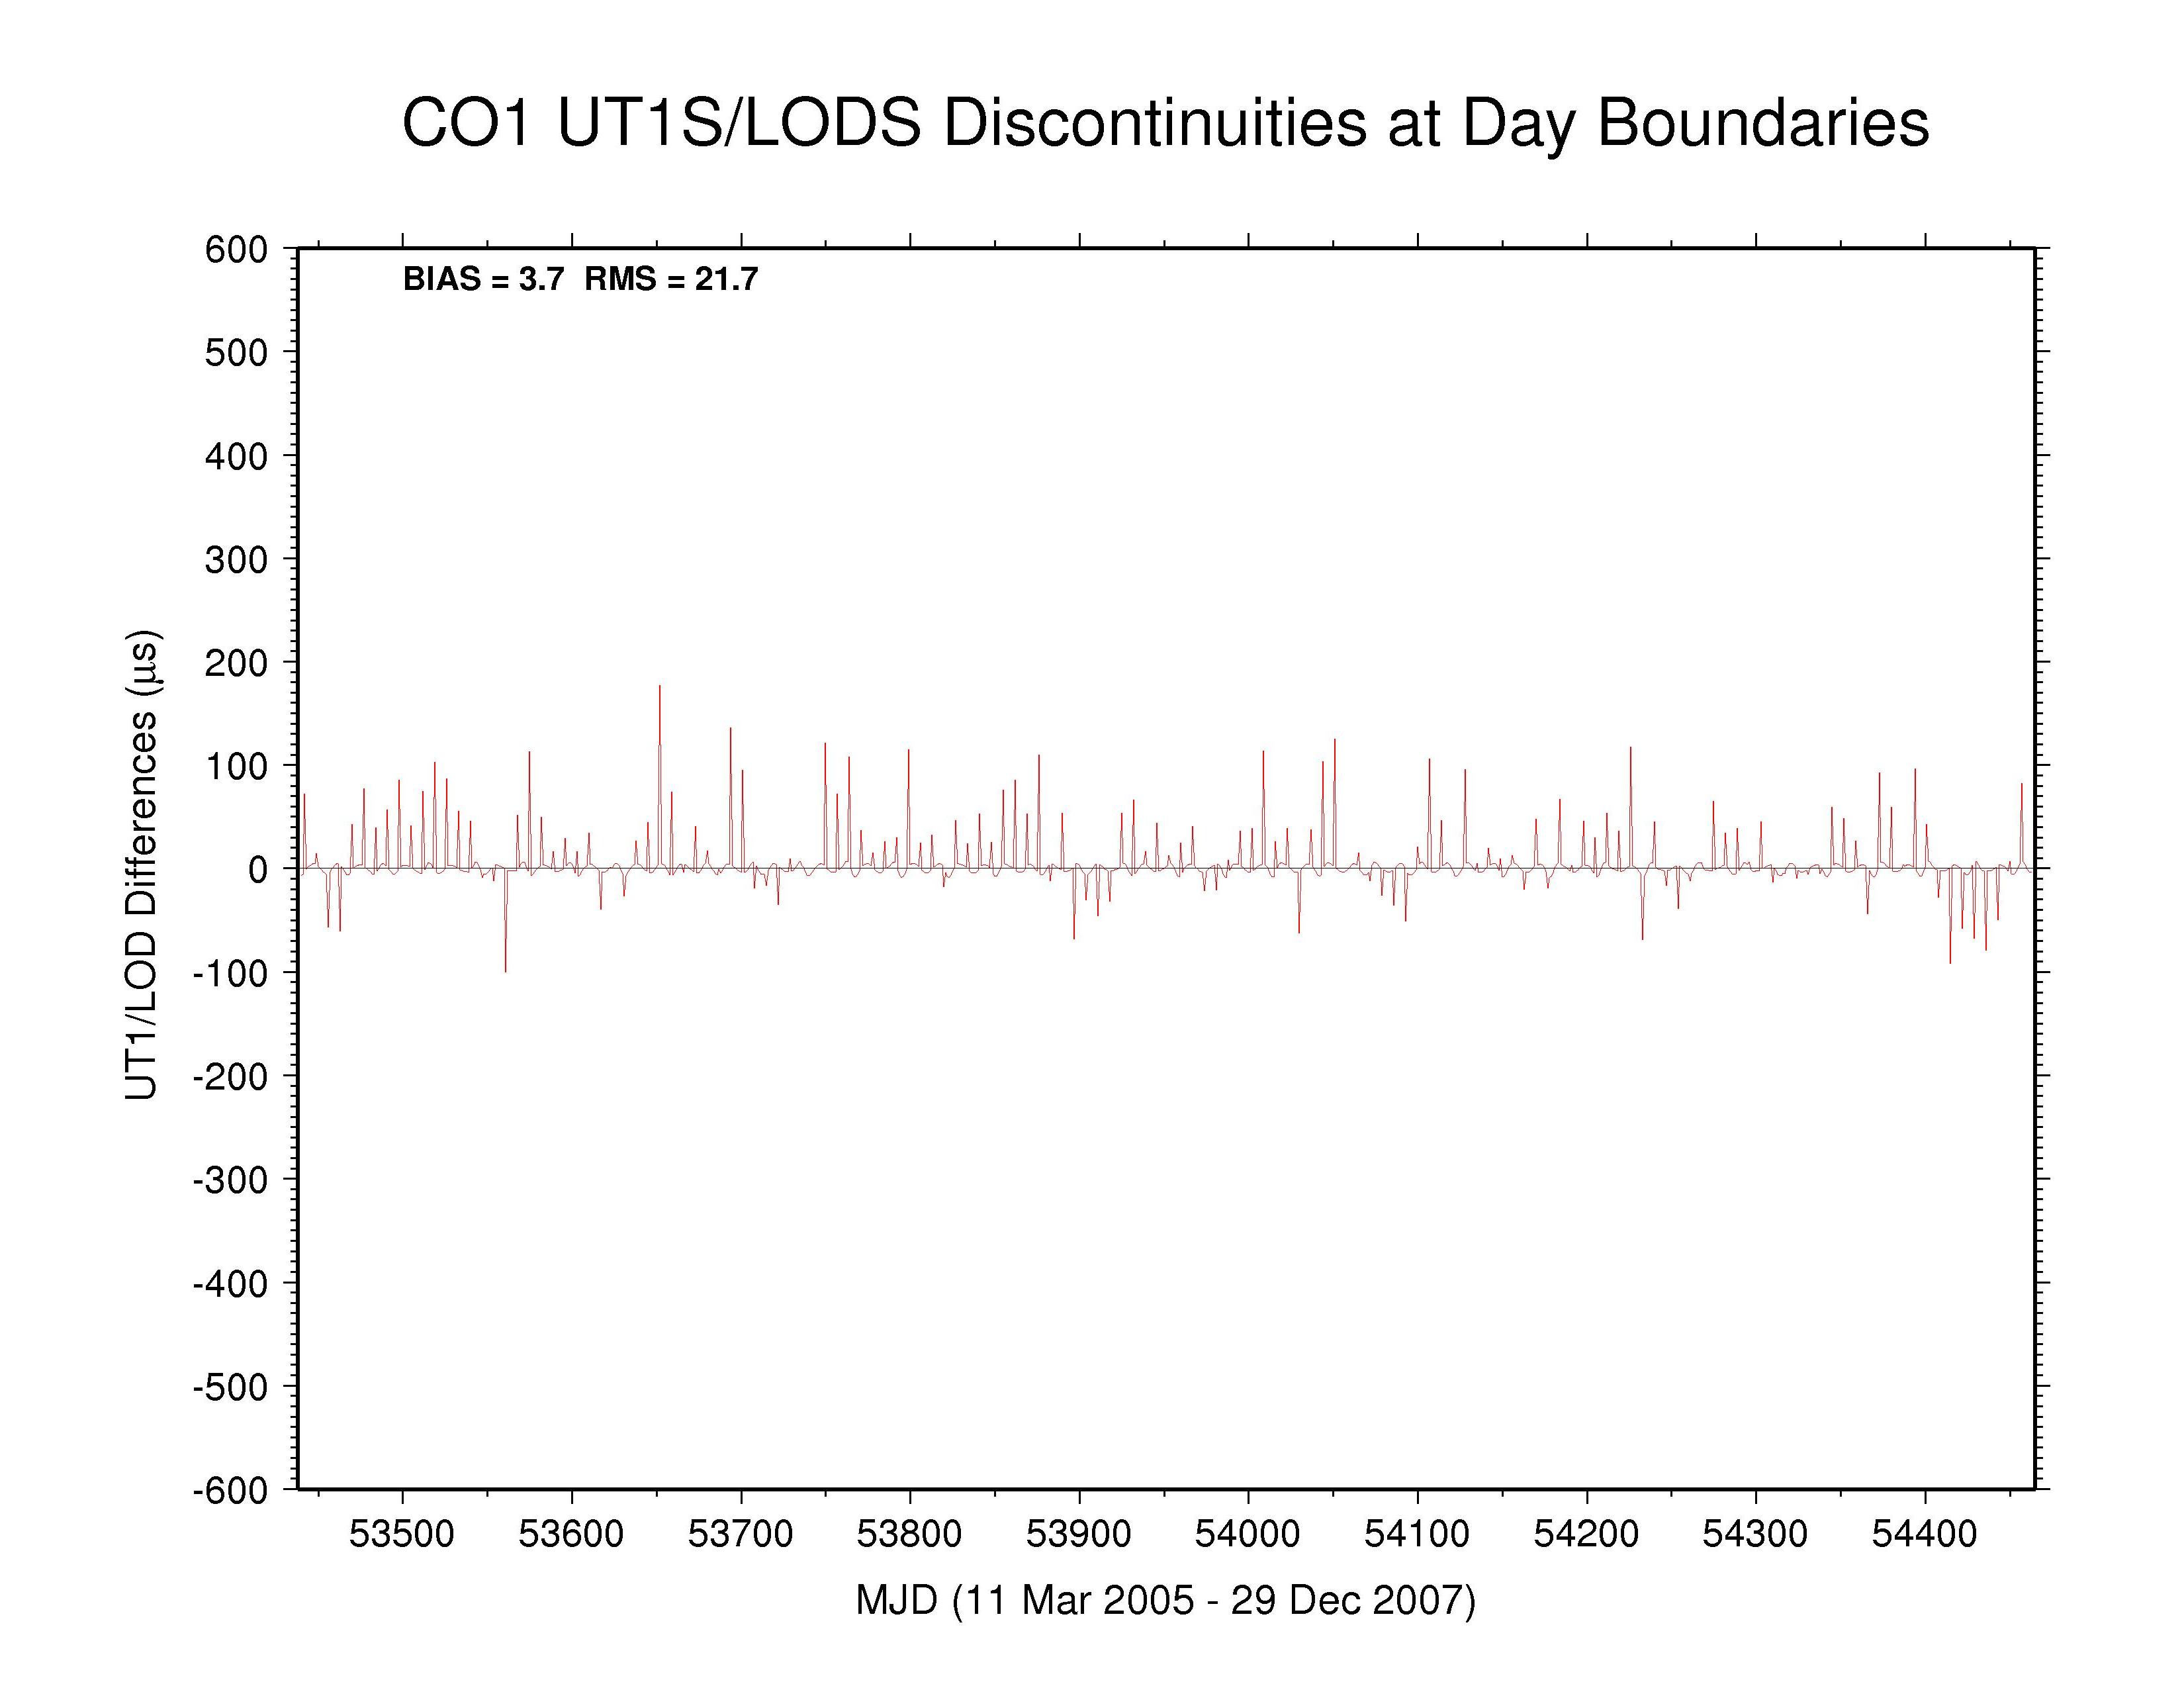
Day-boundary Discontinuities in UT1S/LODS Series
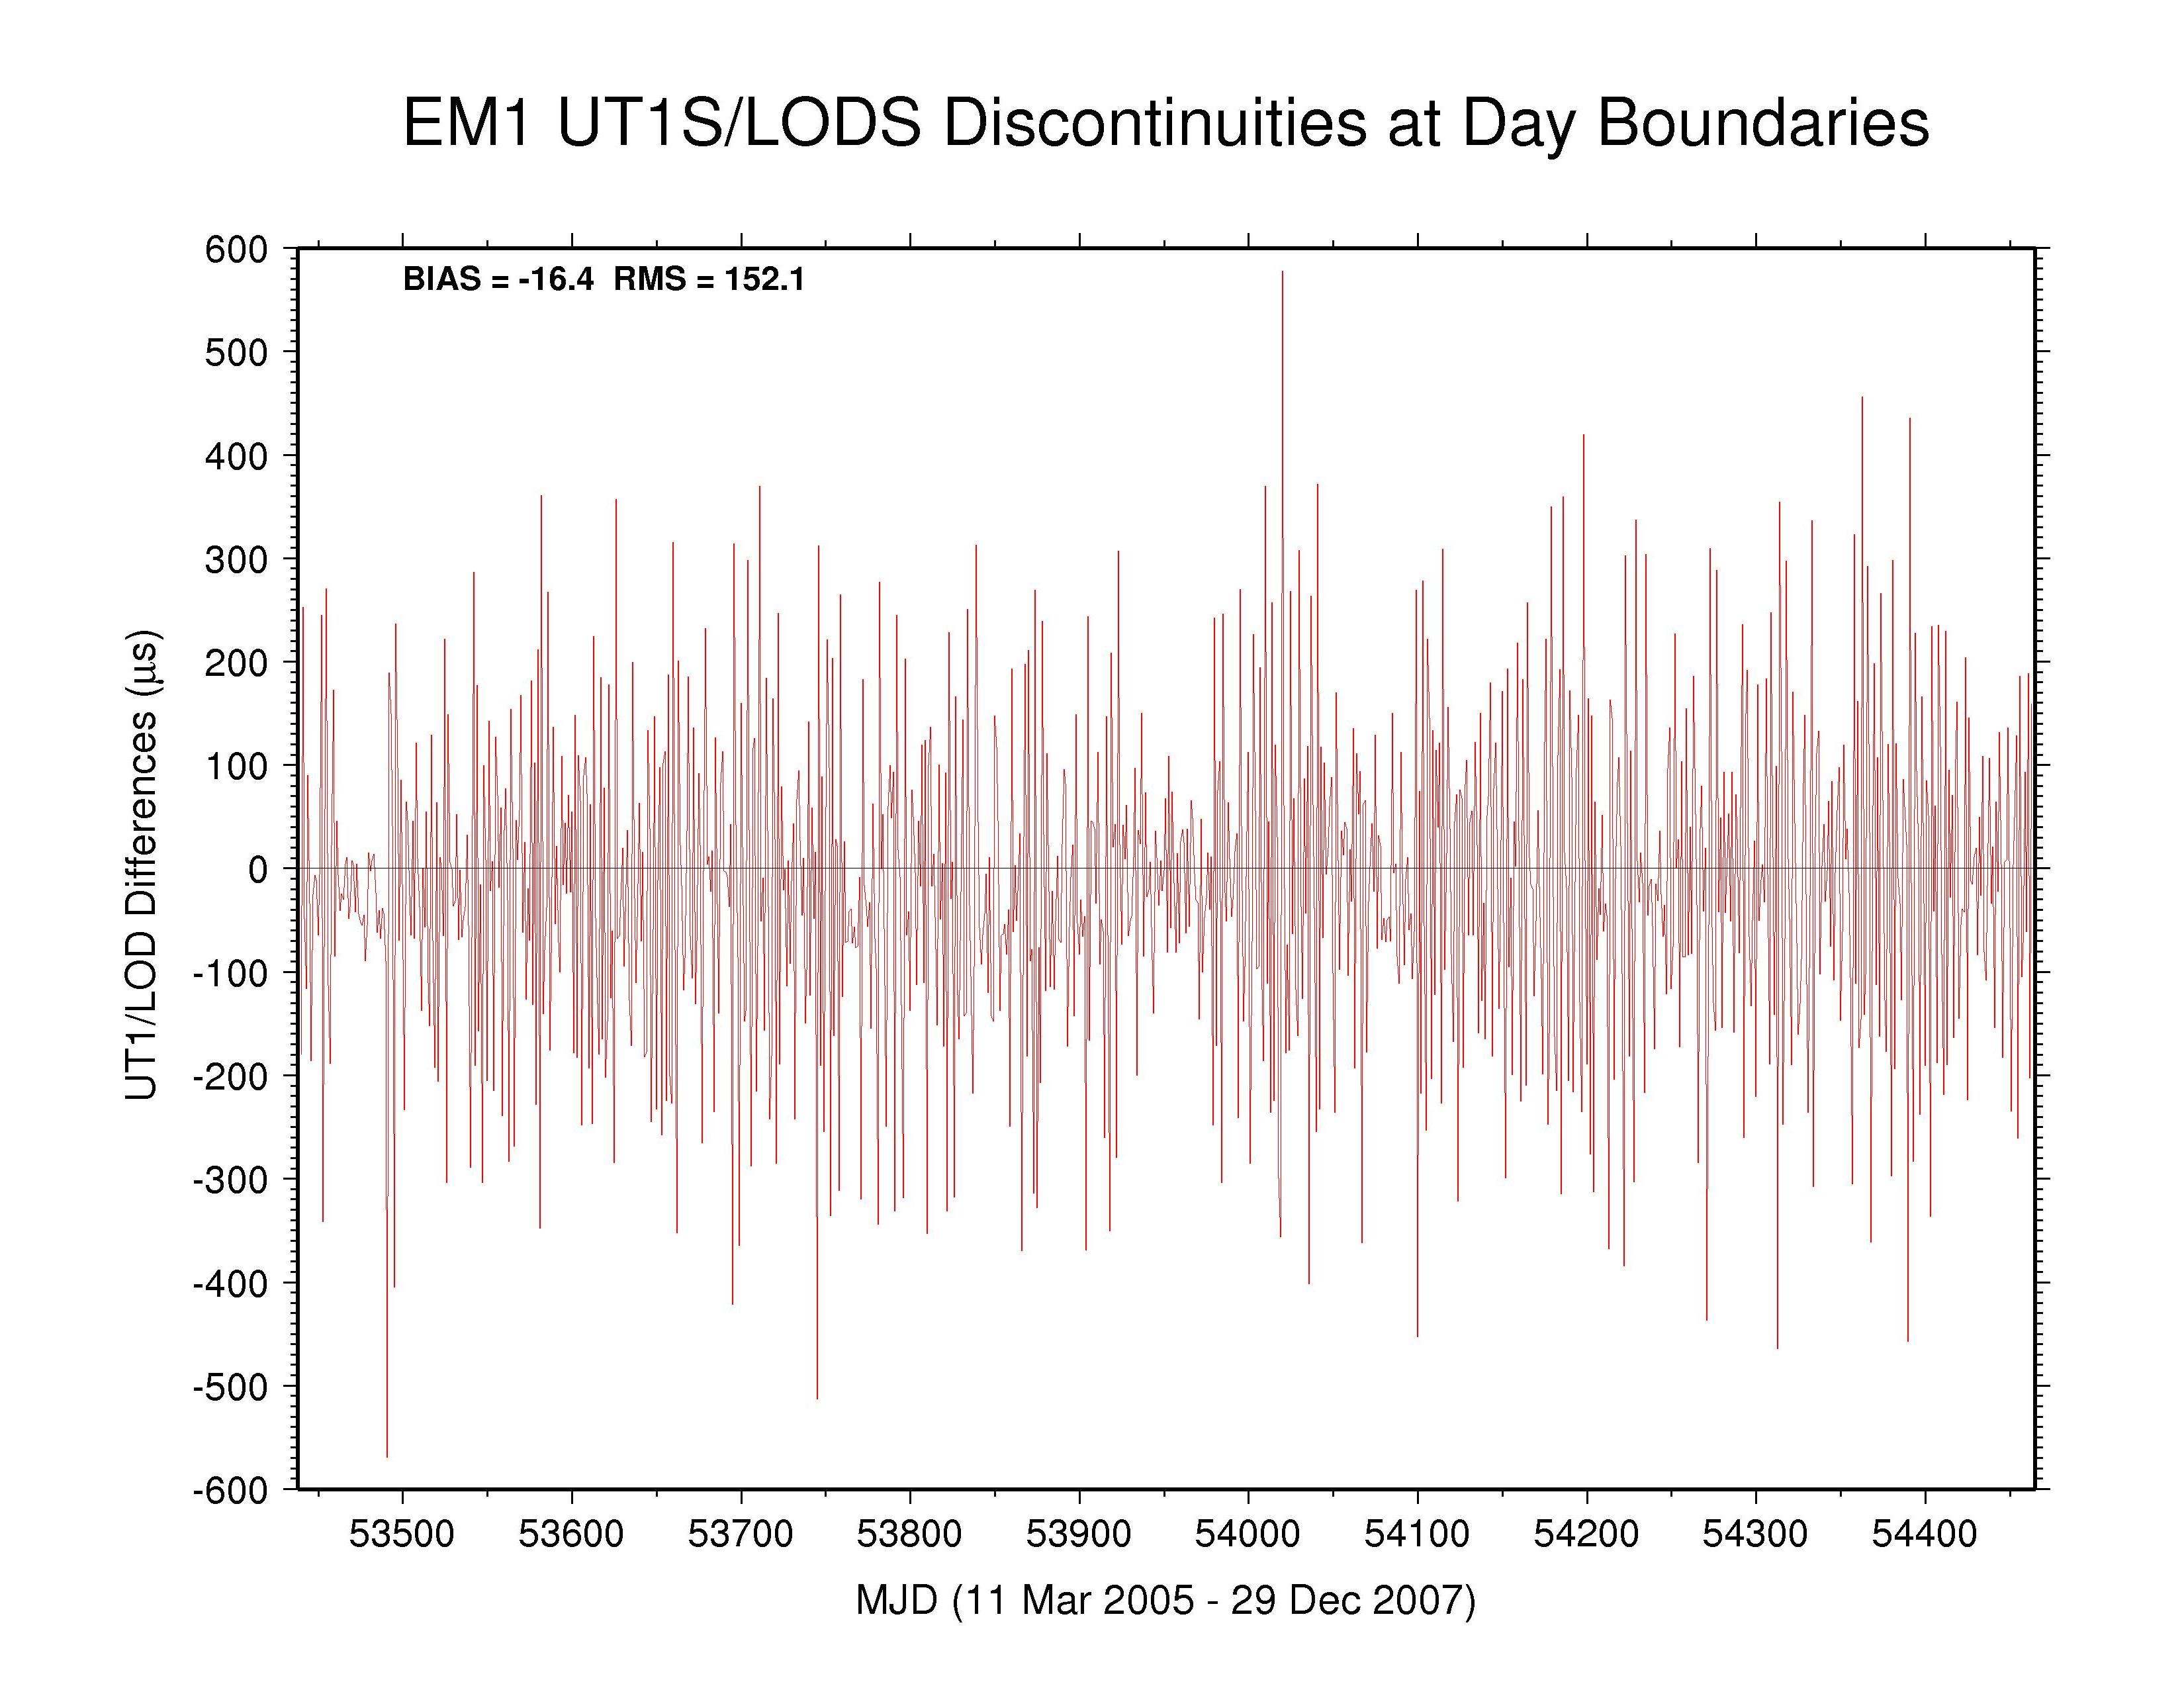
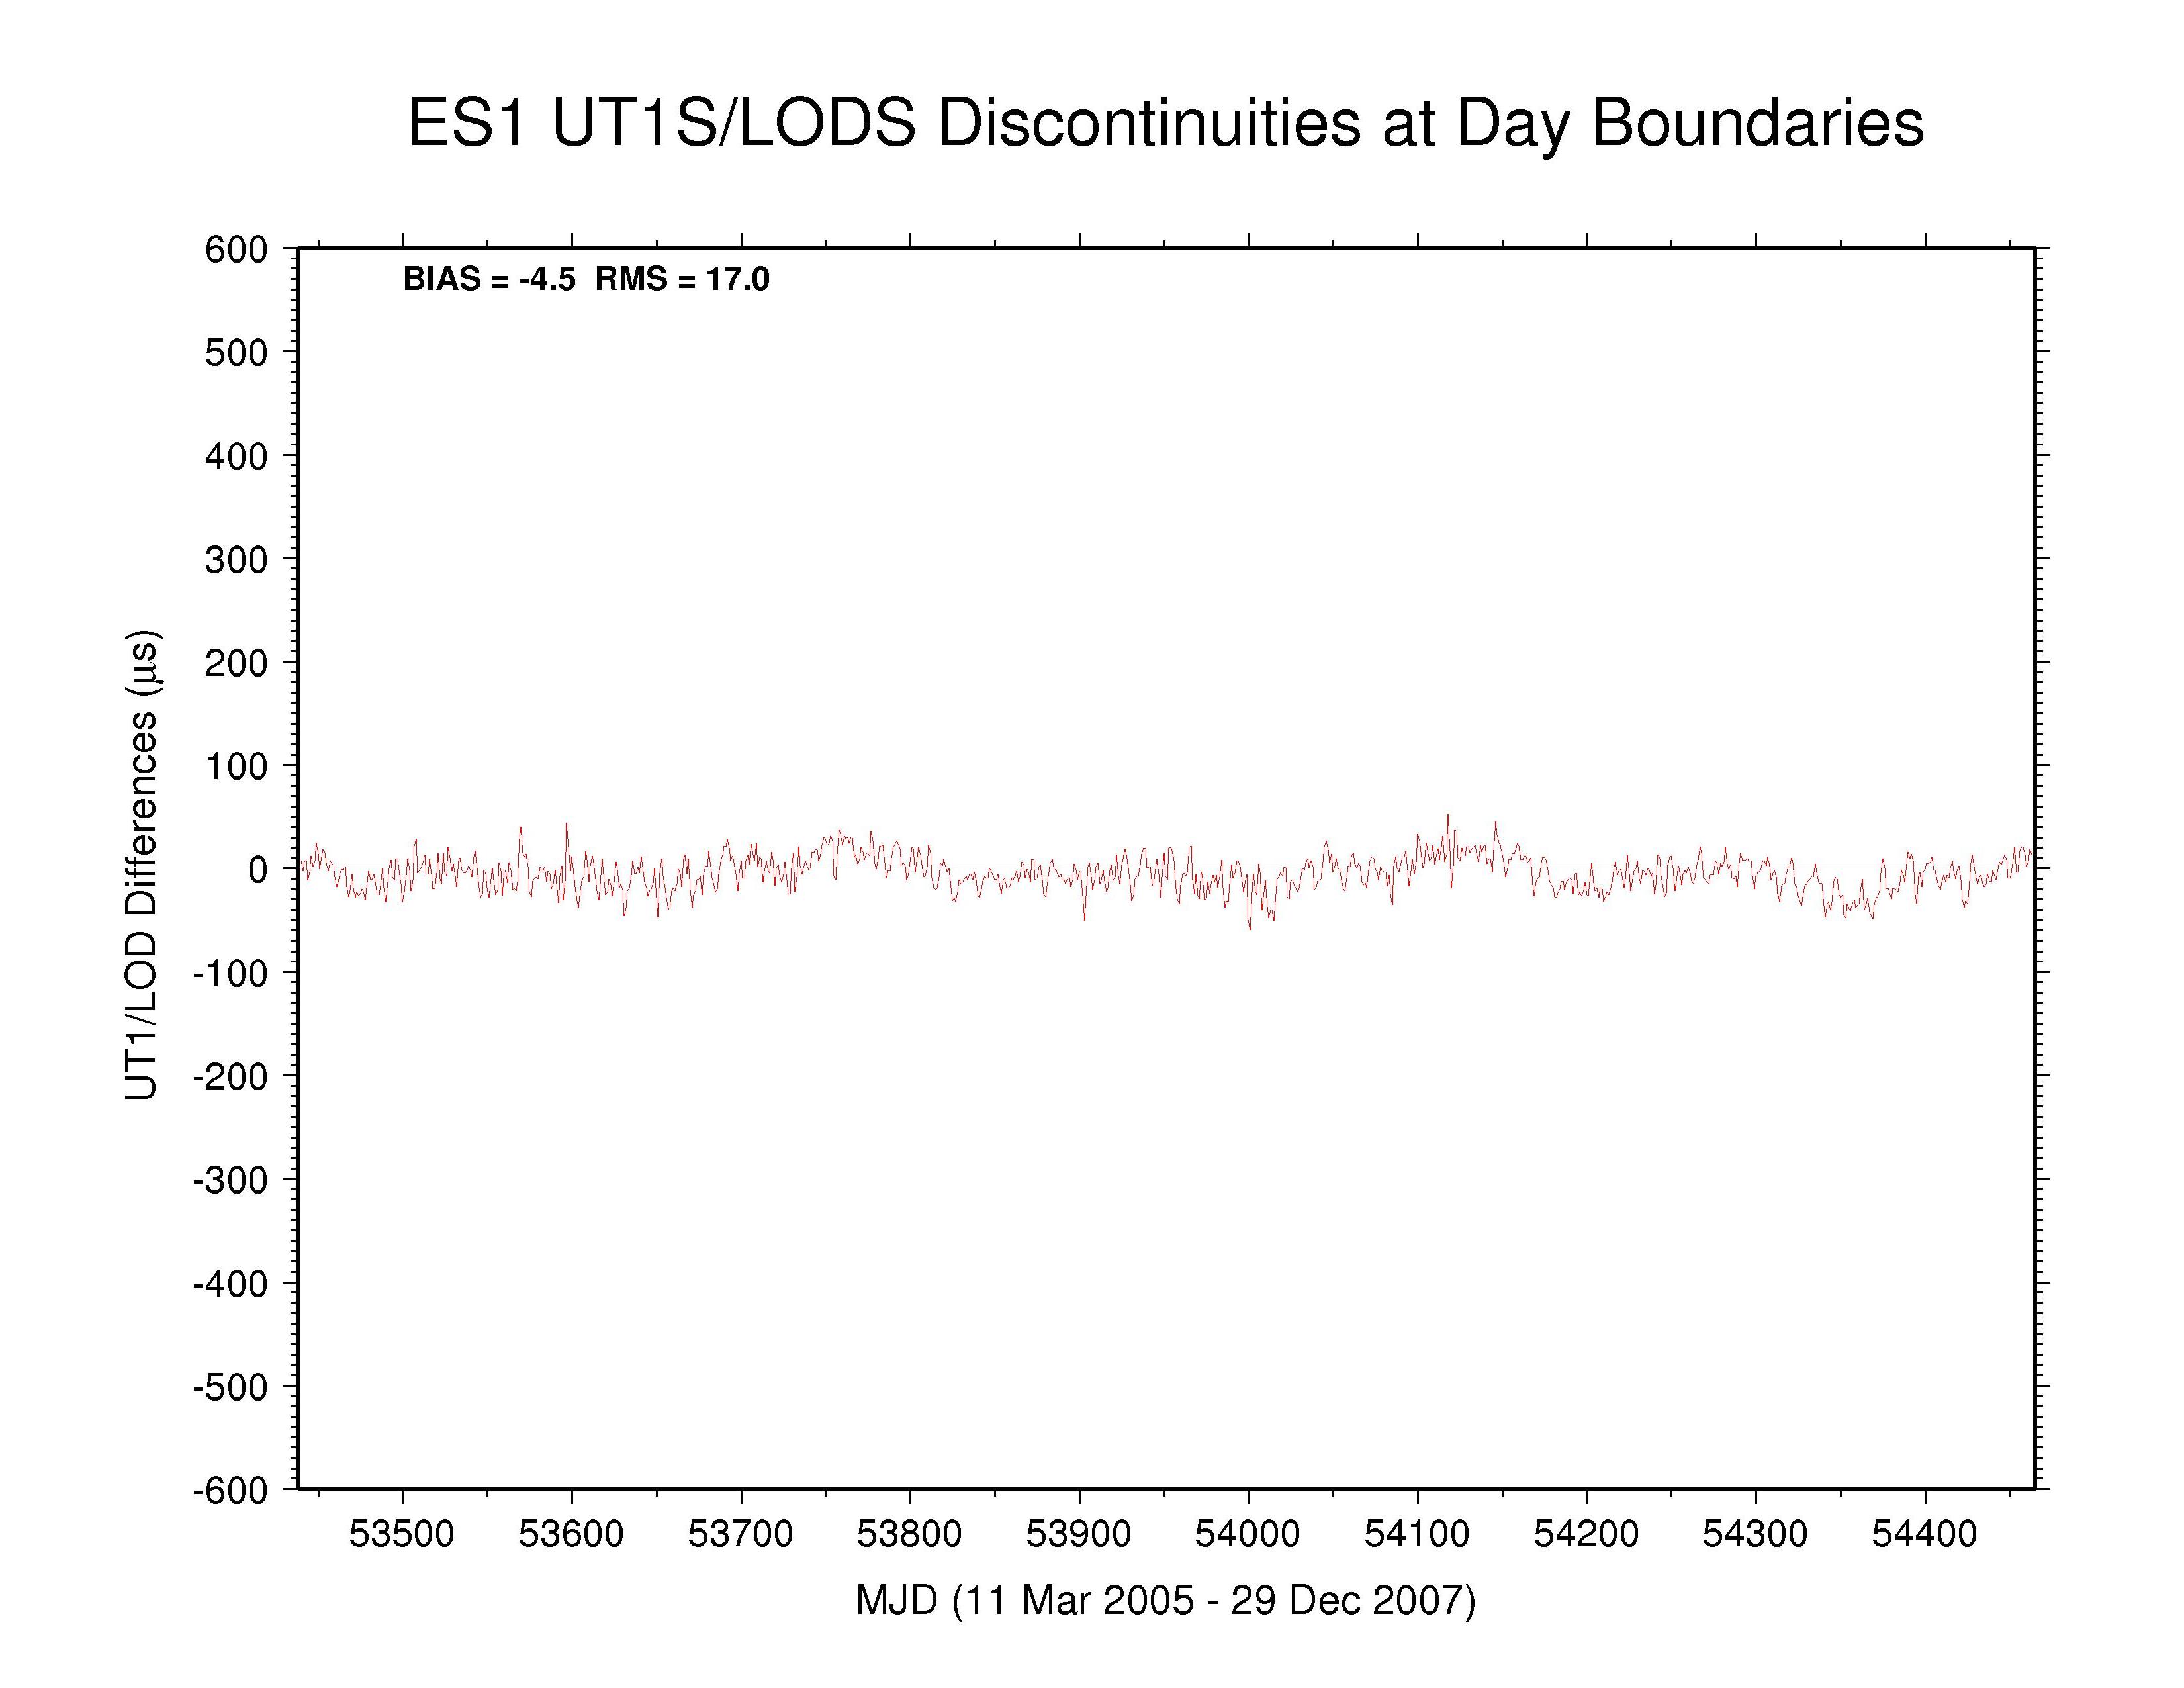
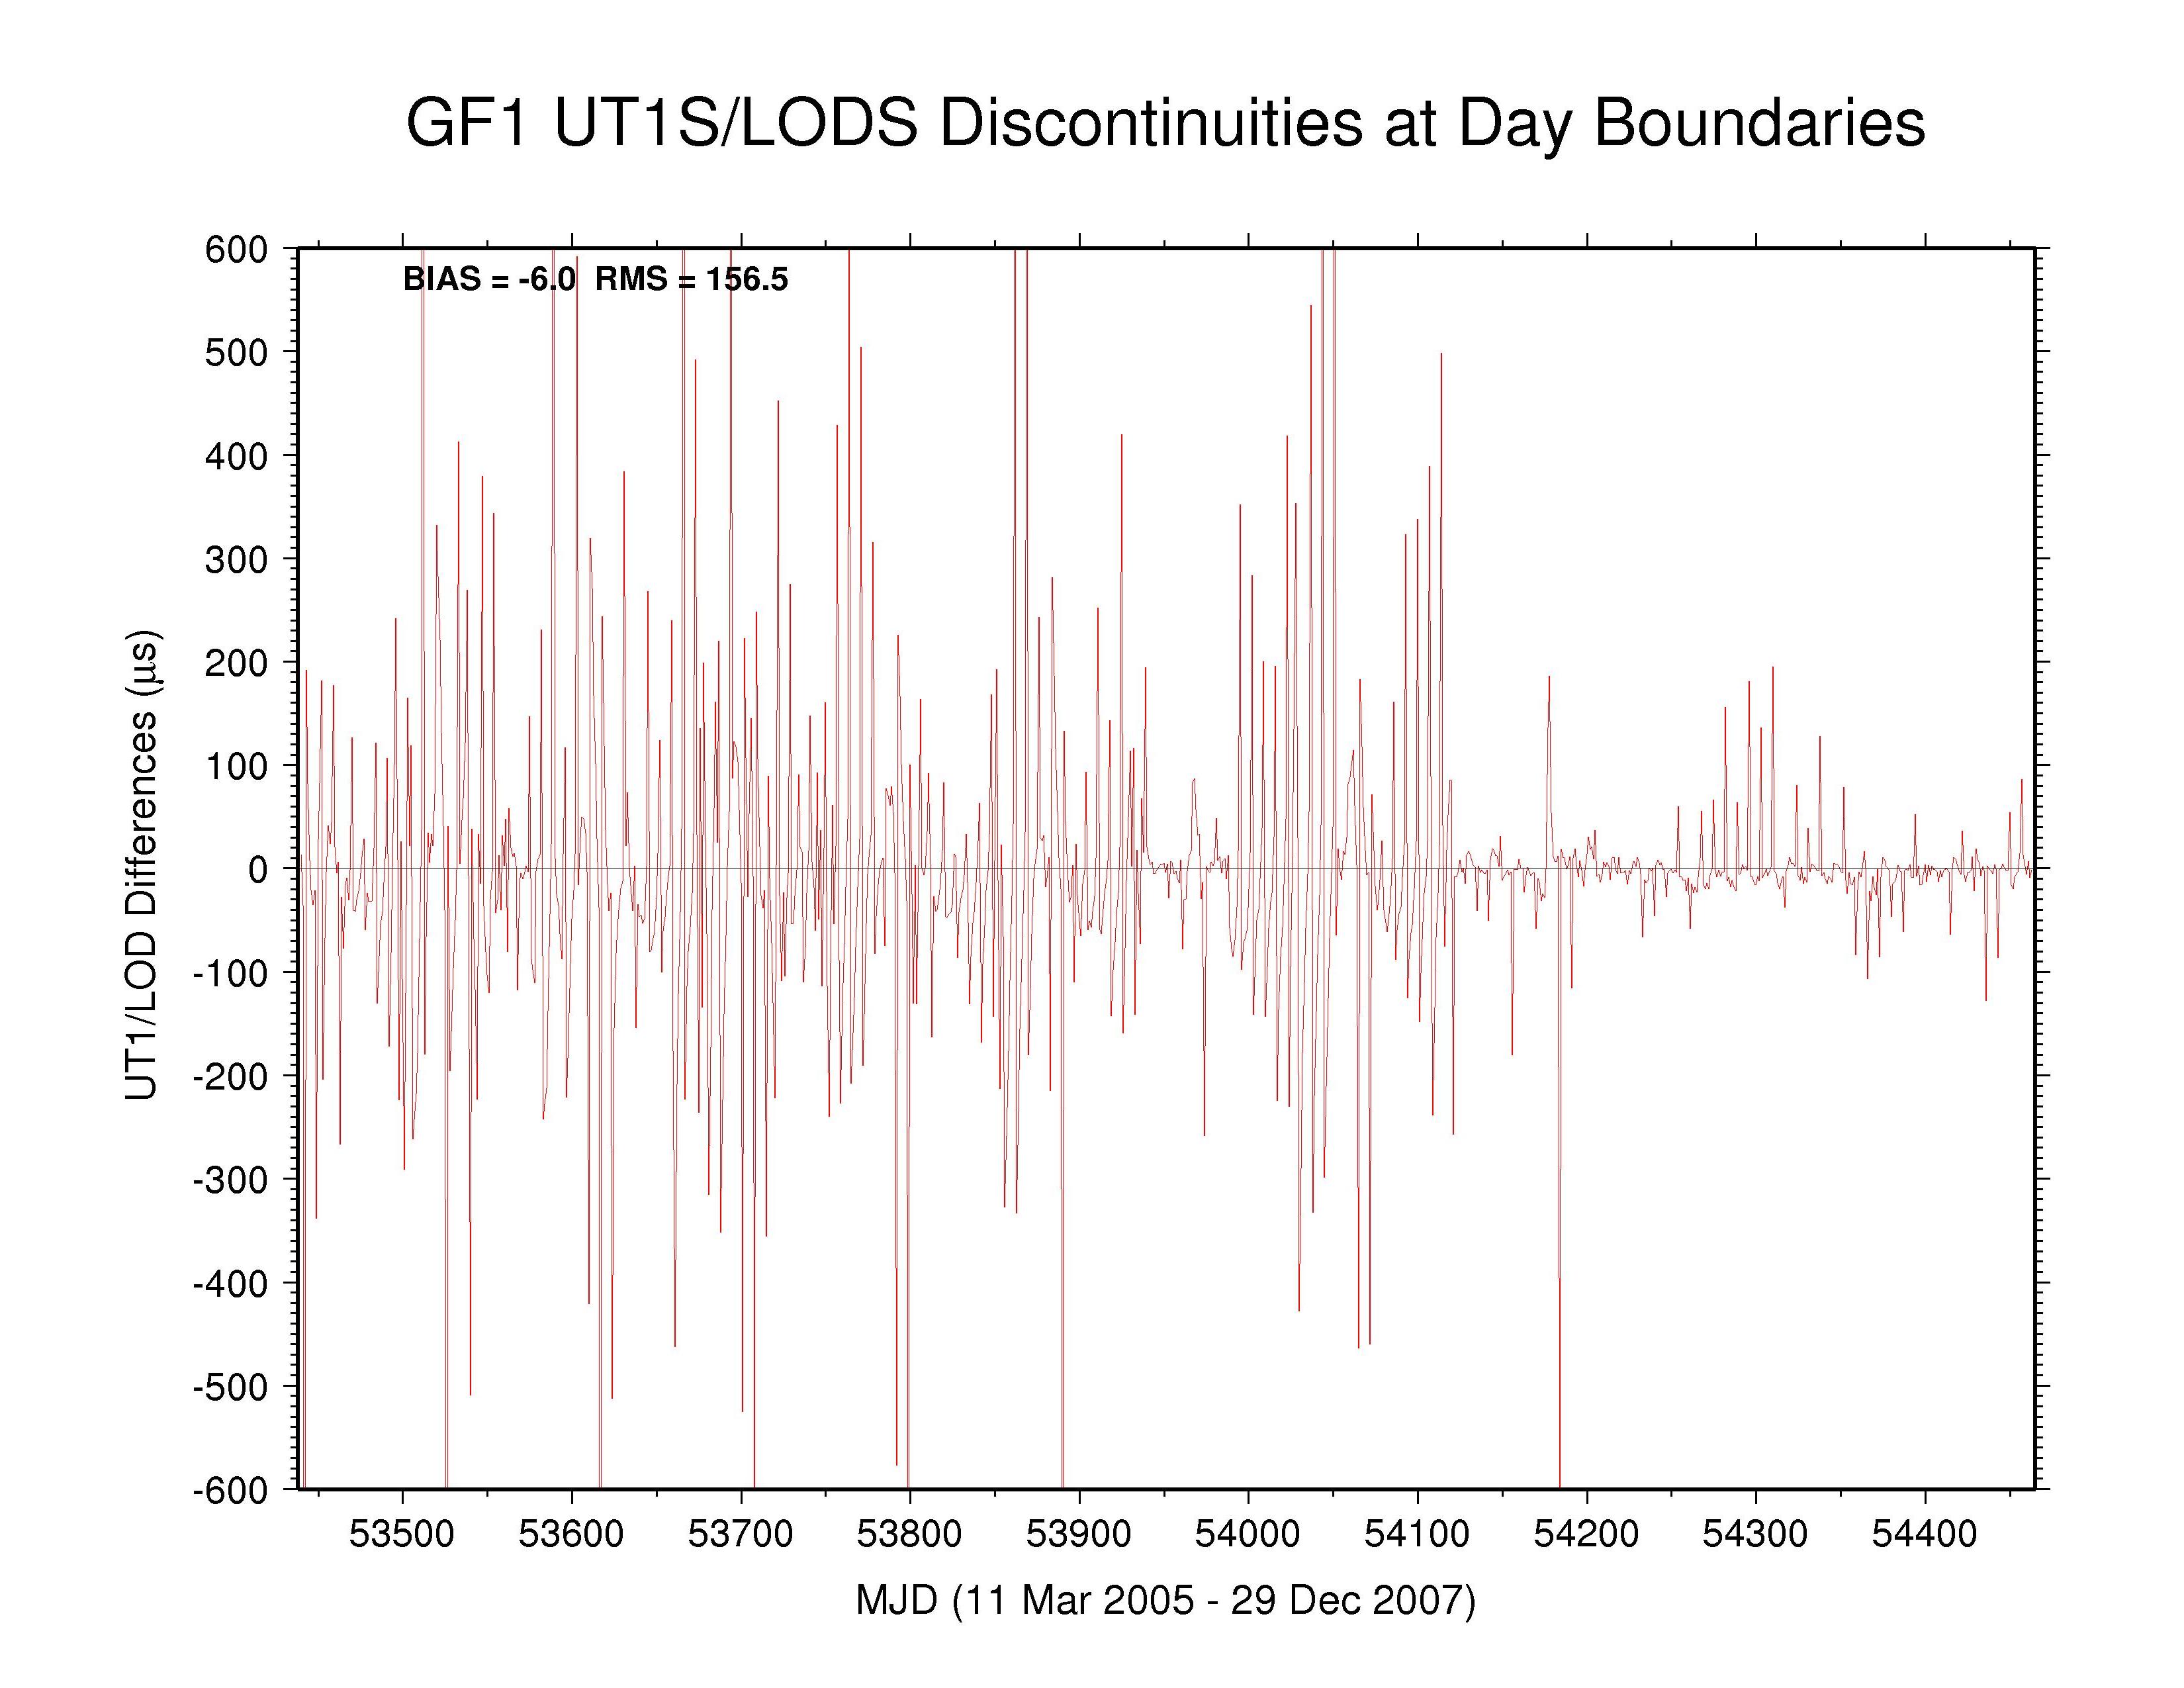
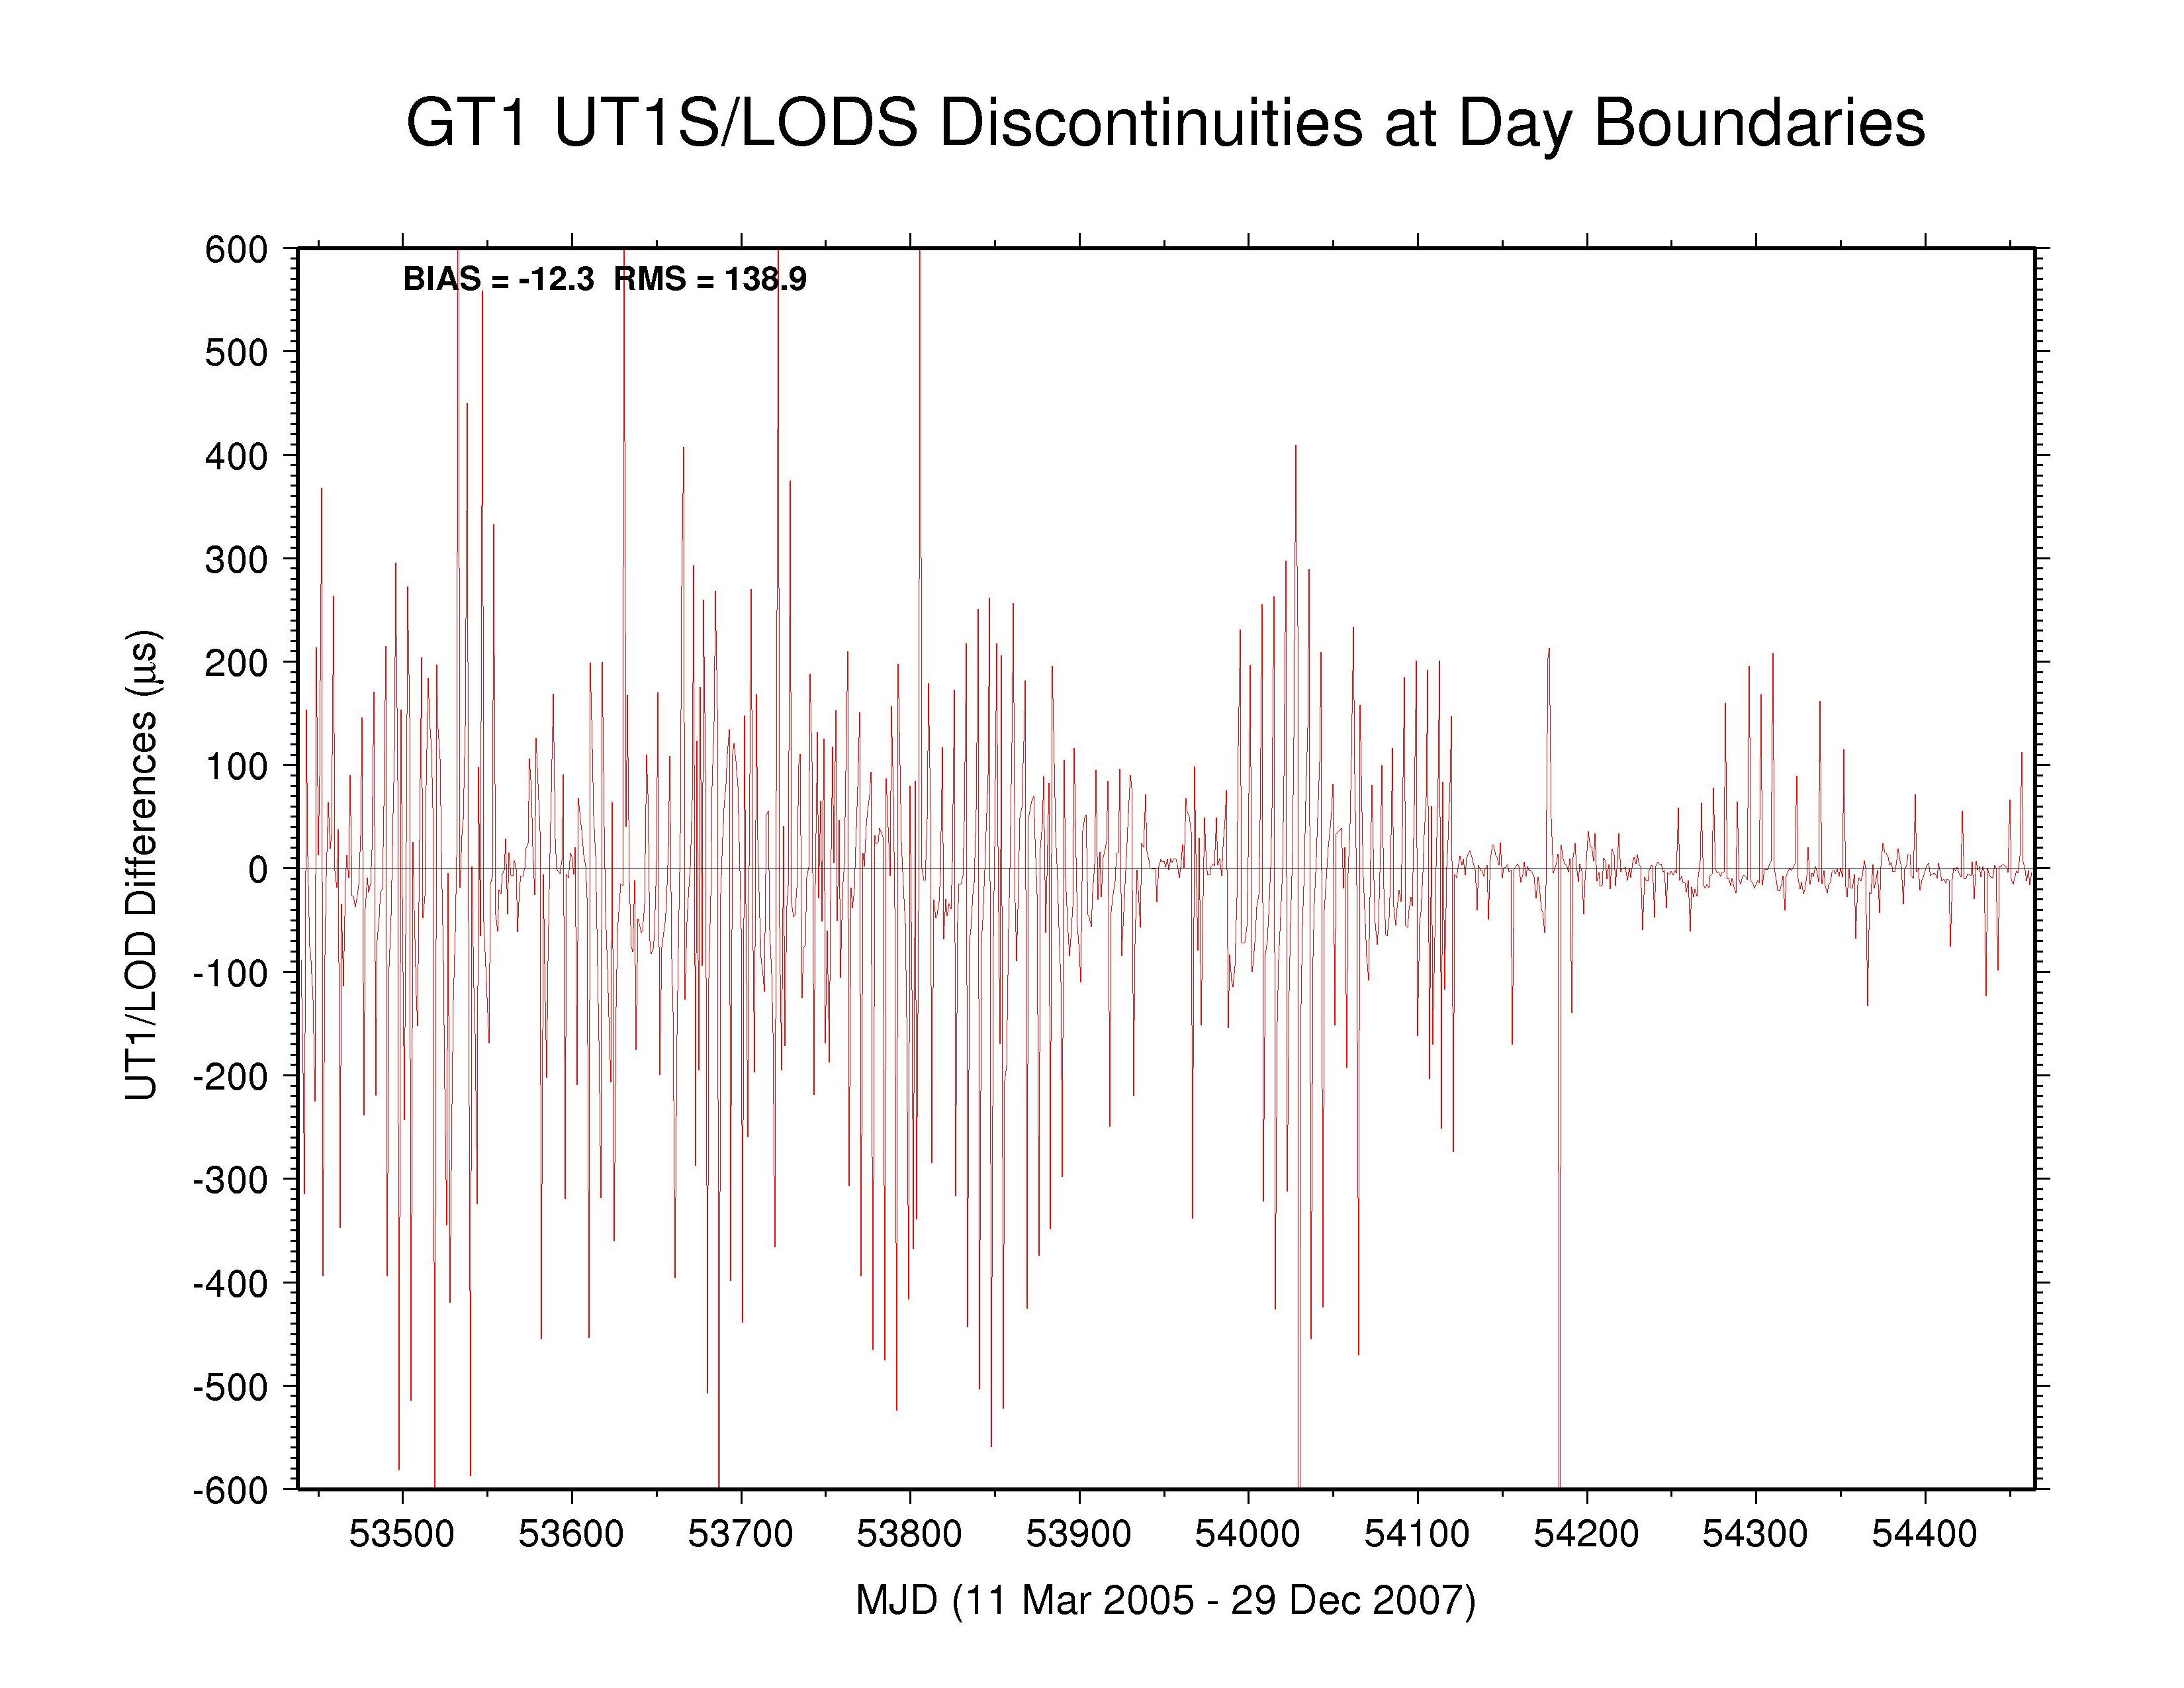
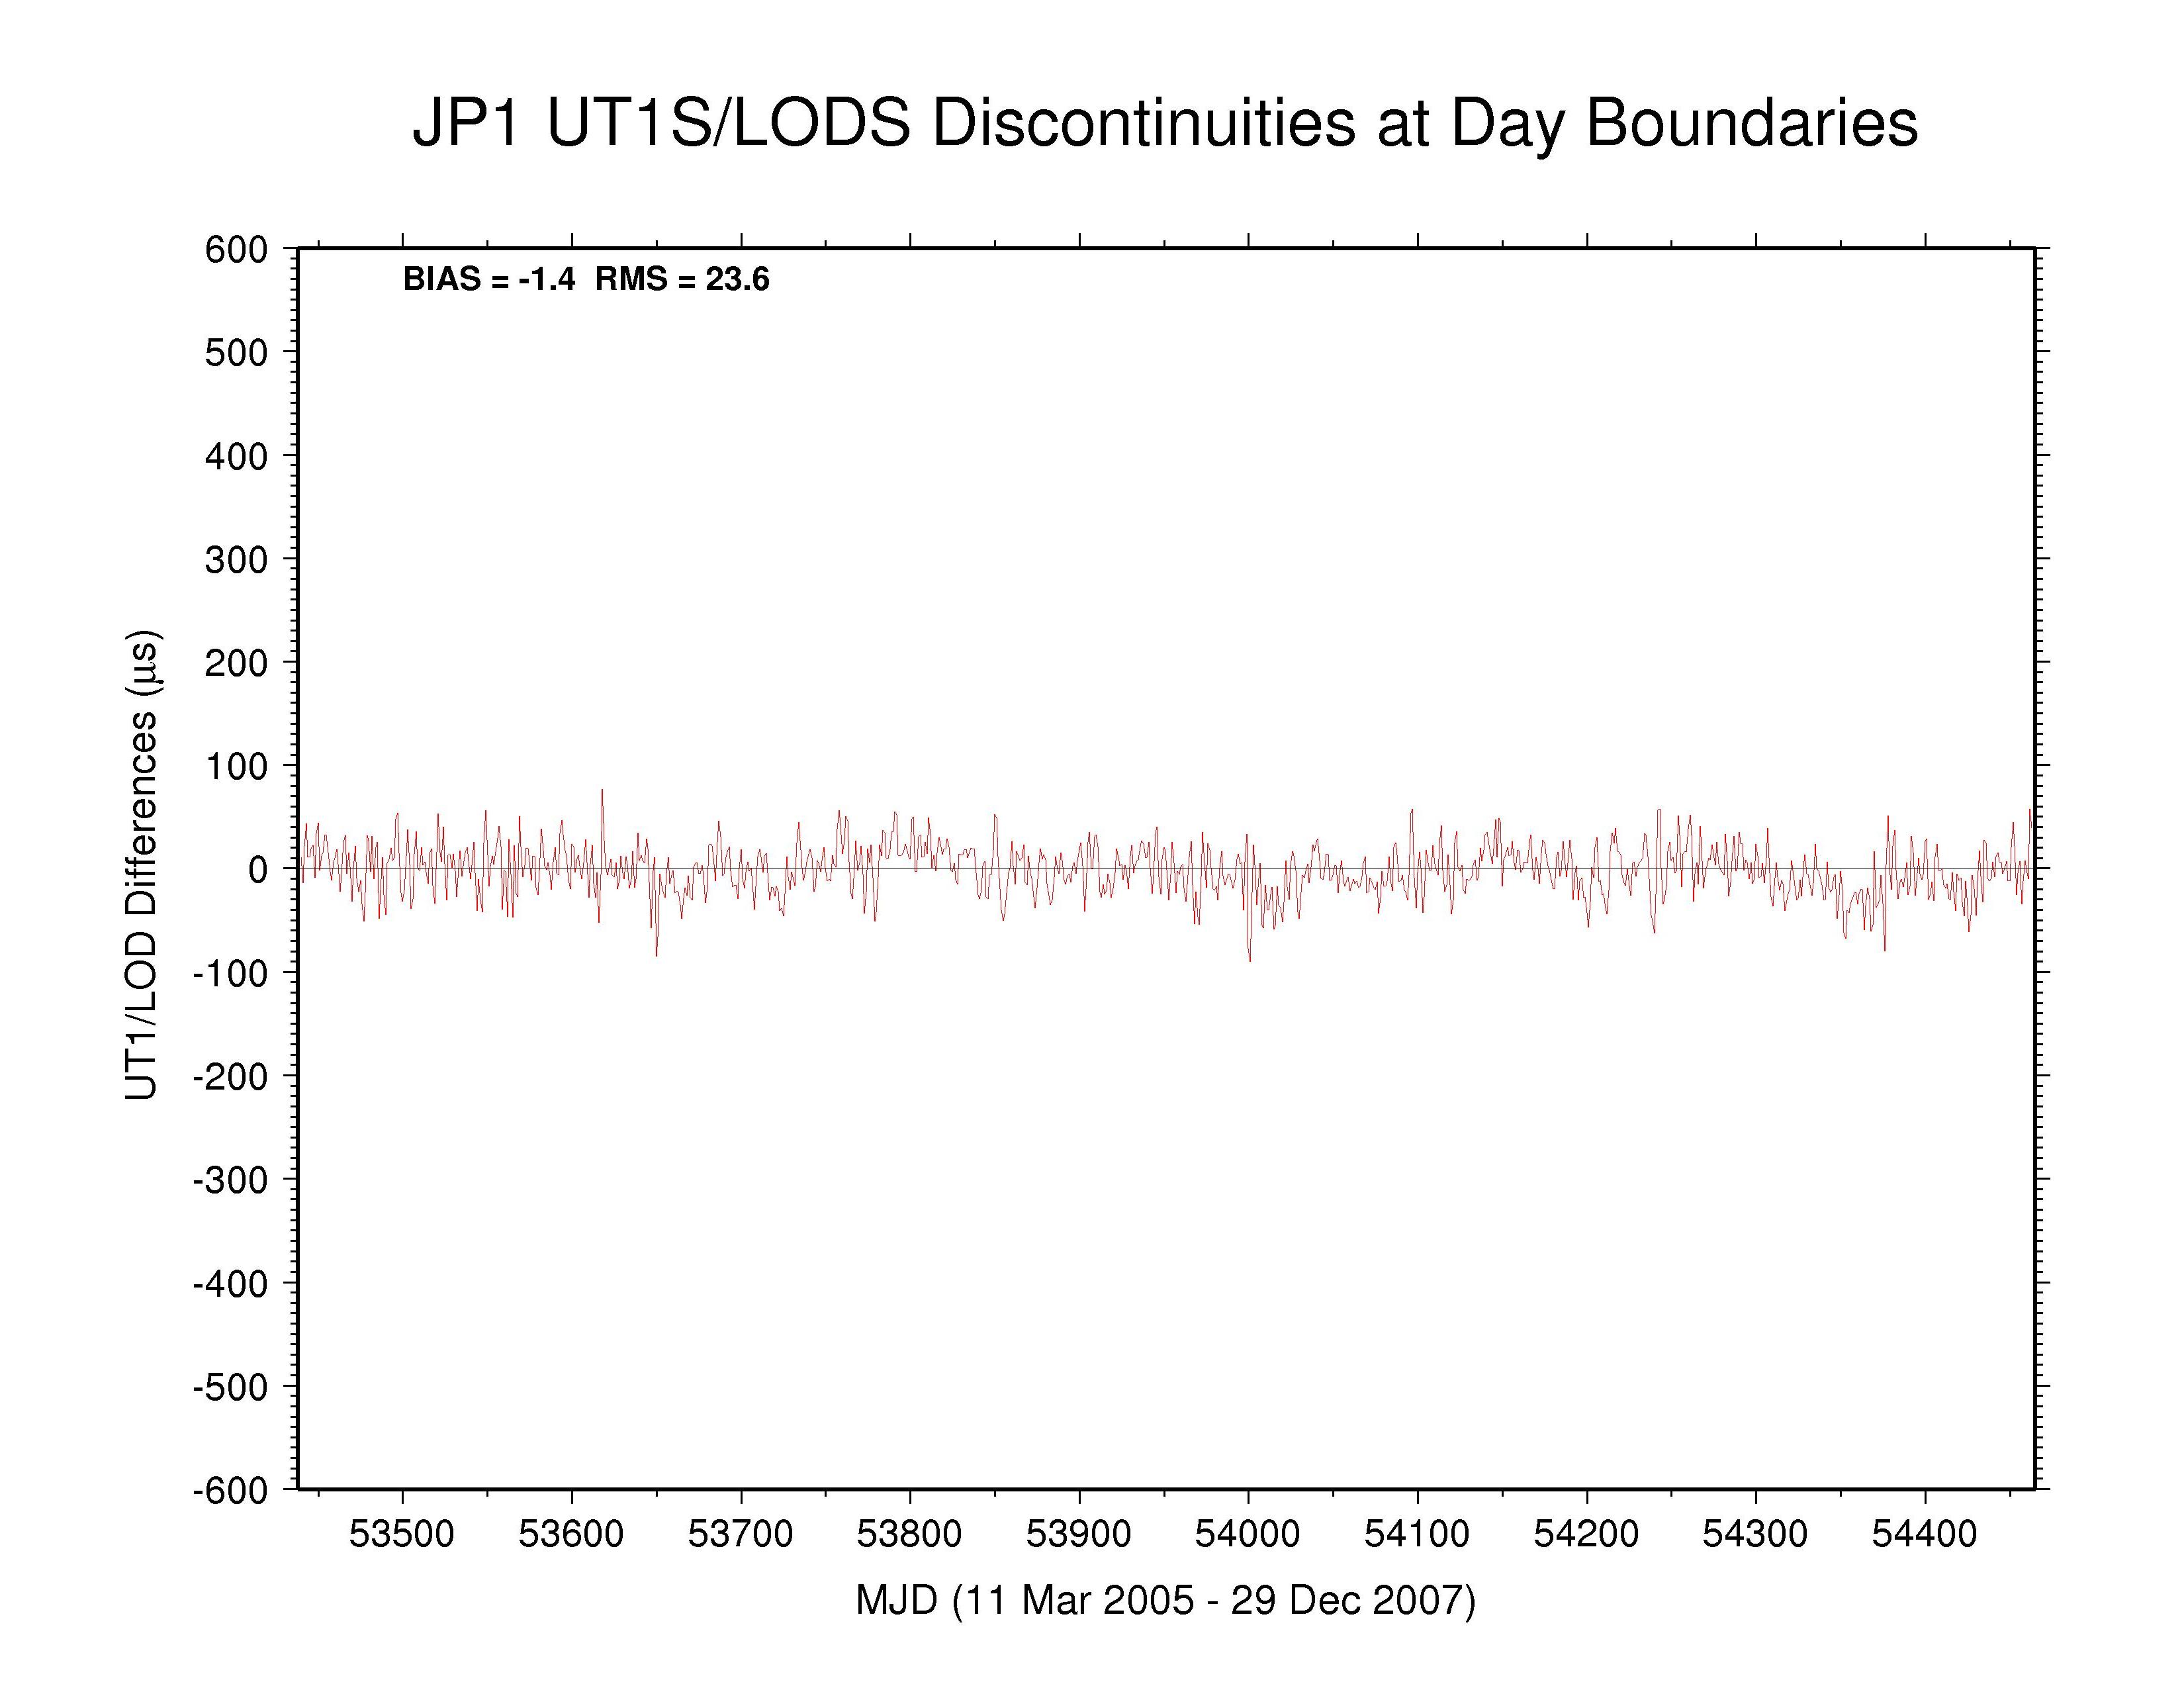
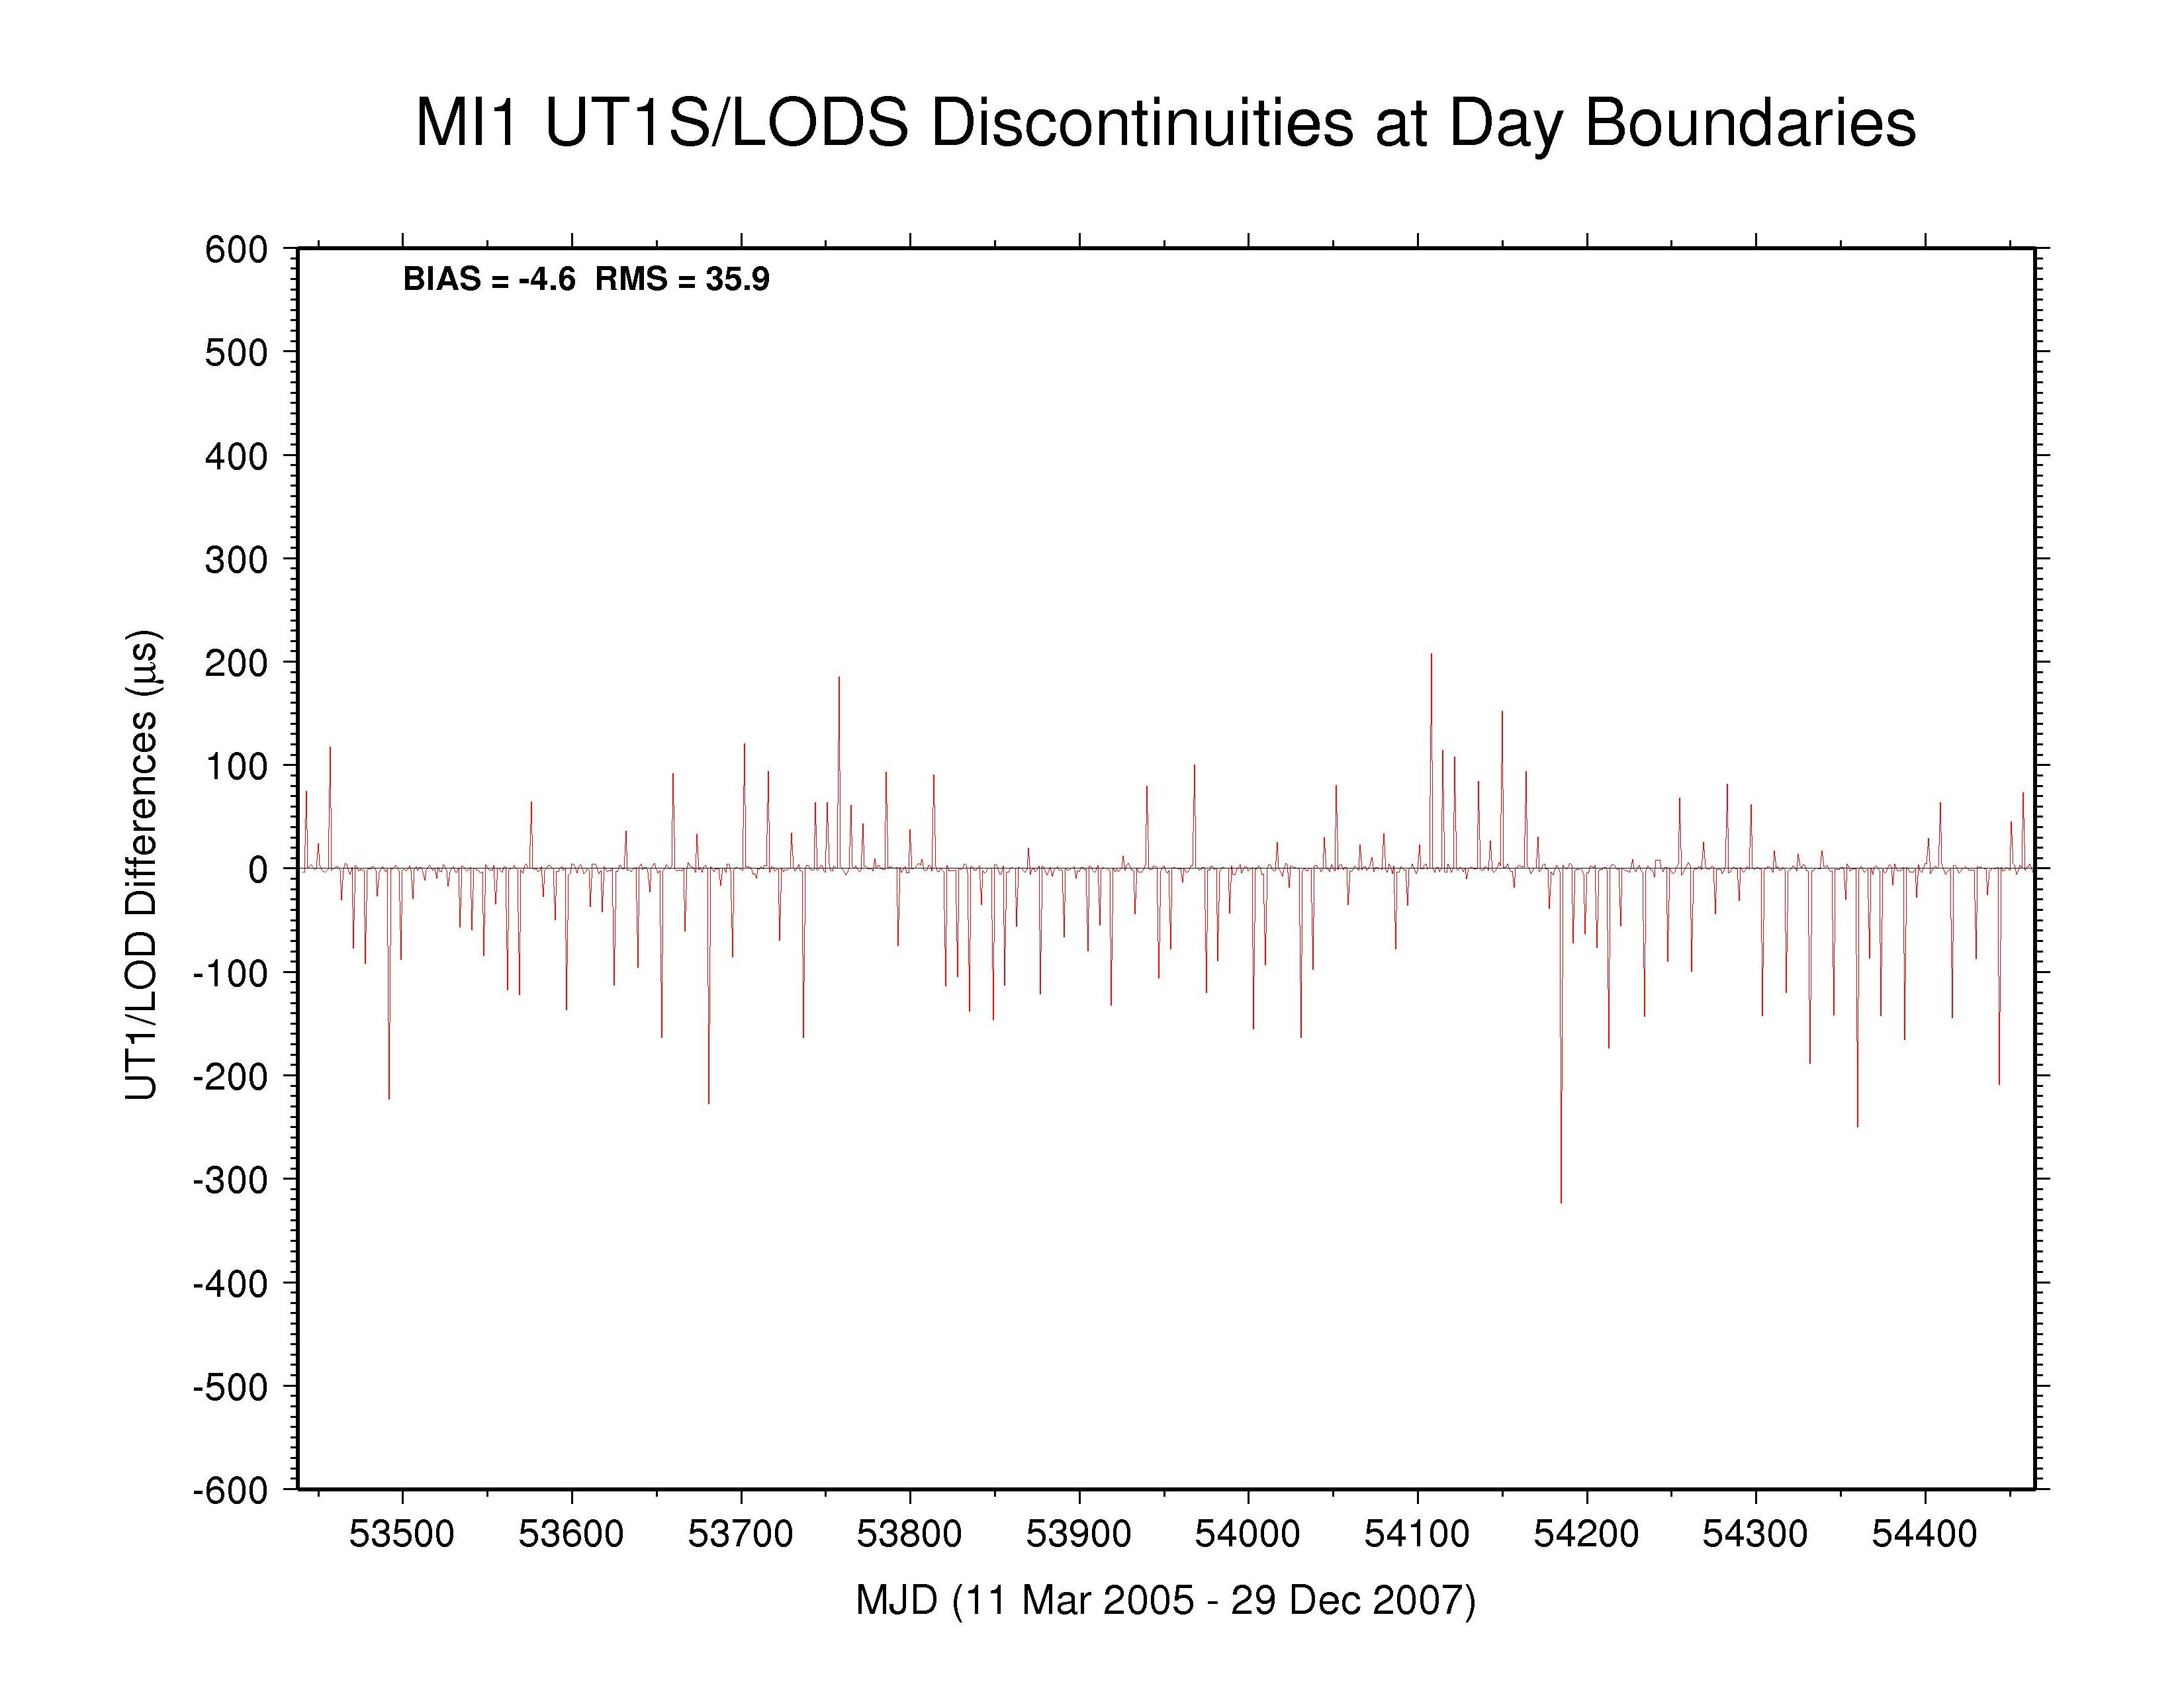
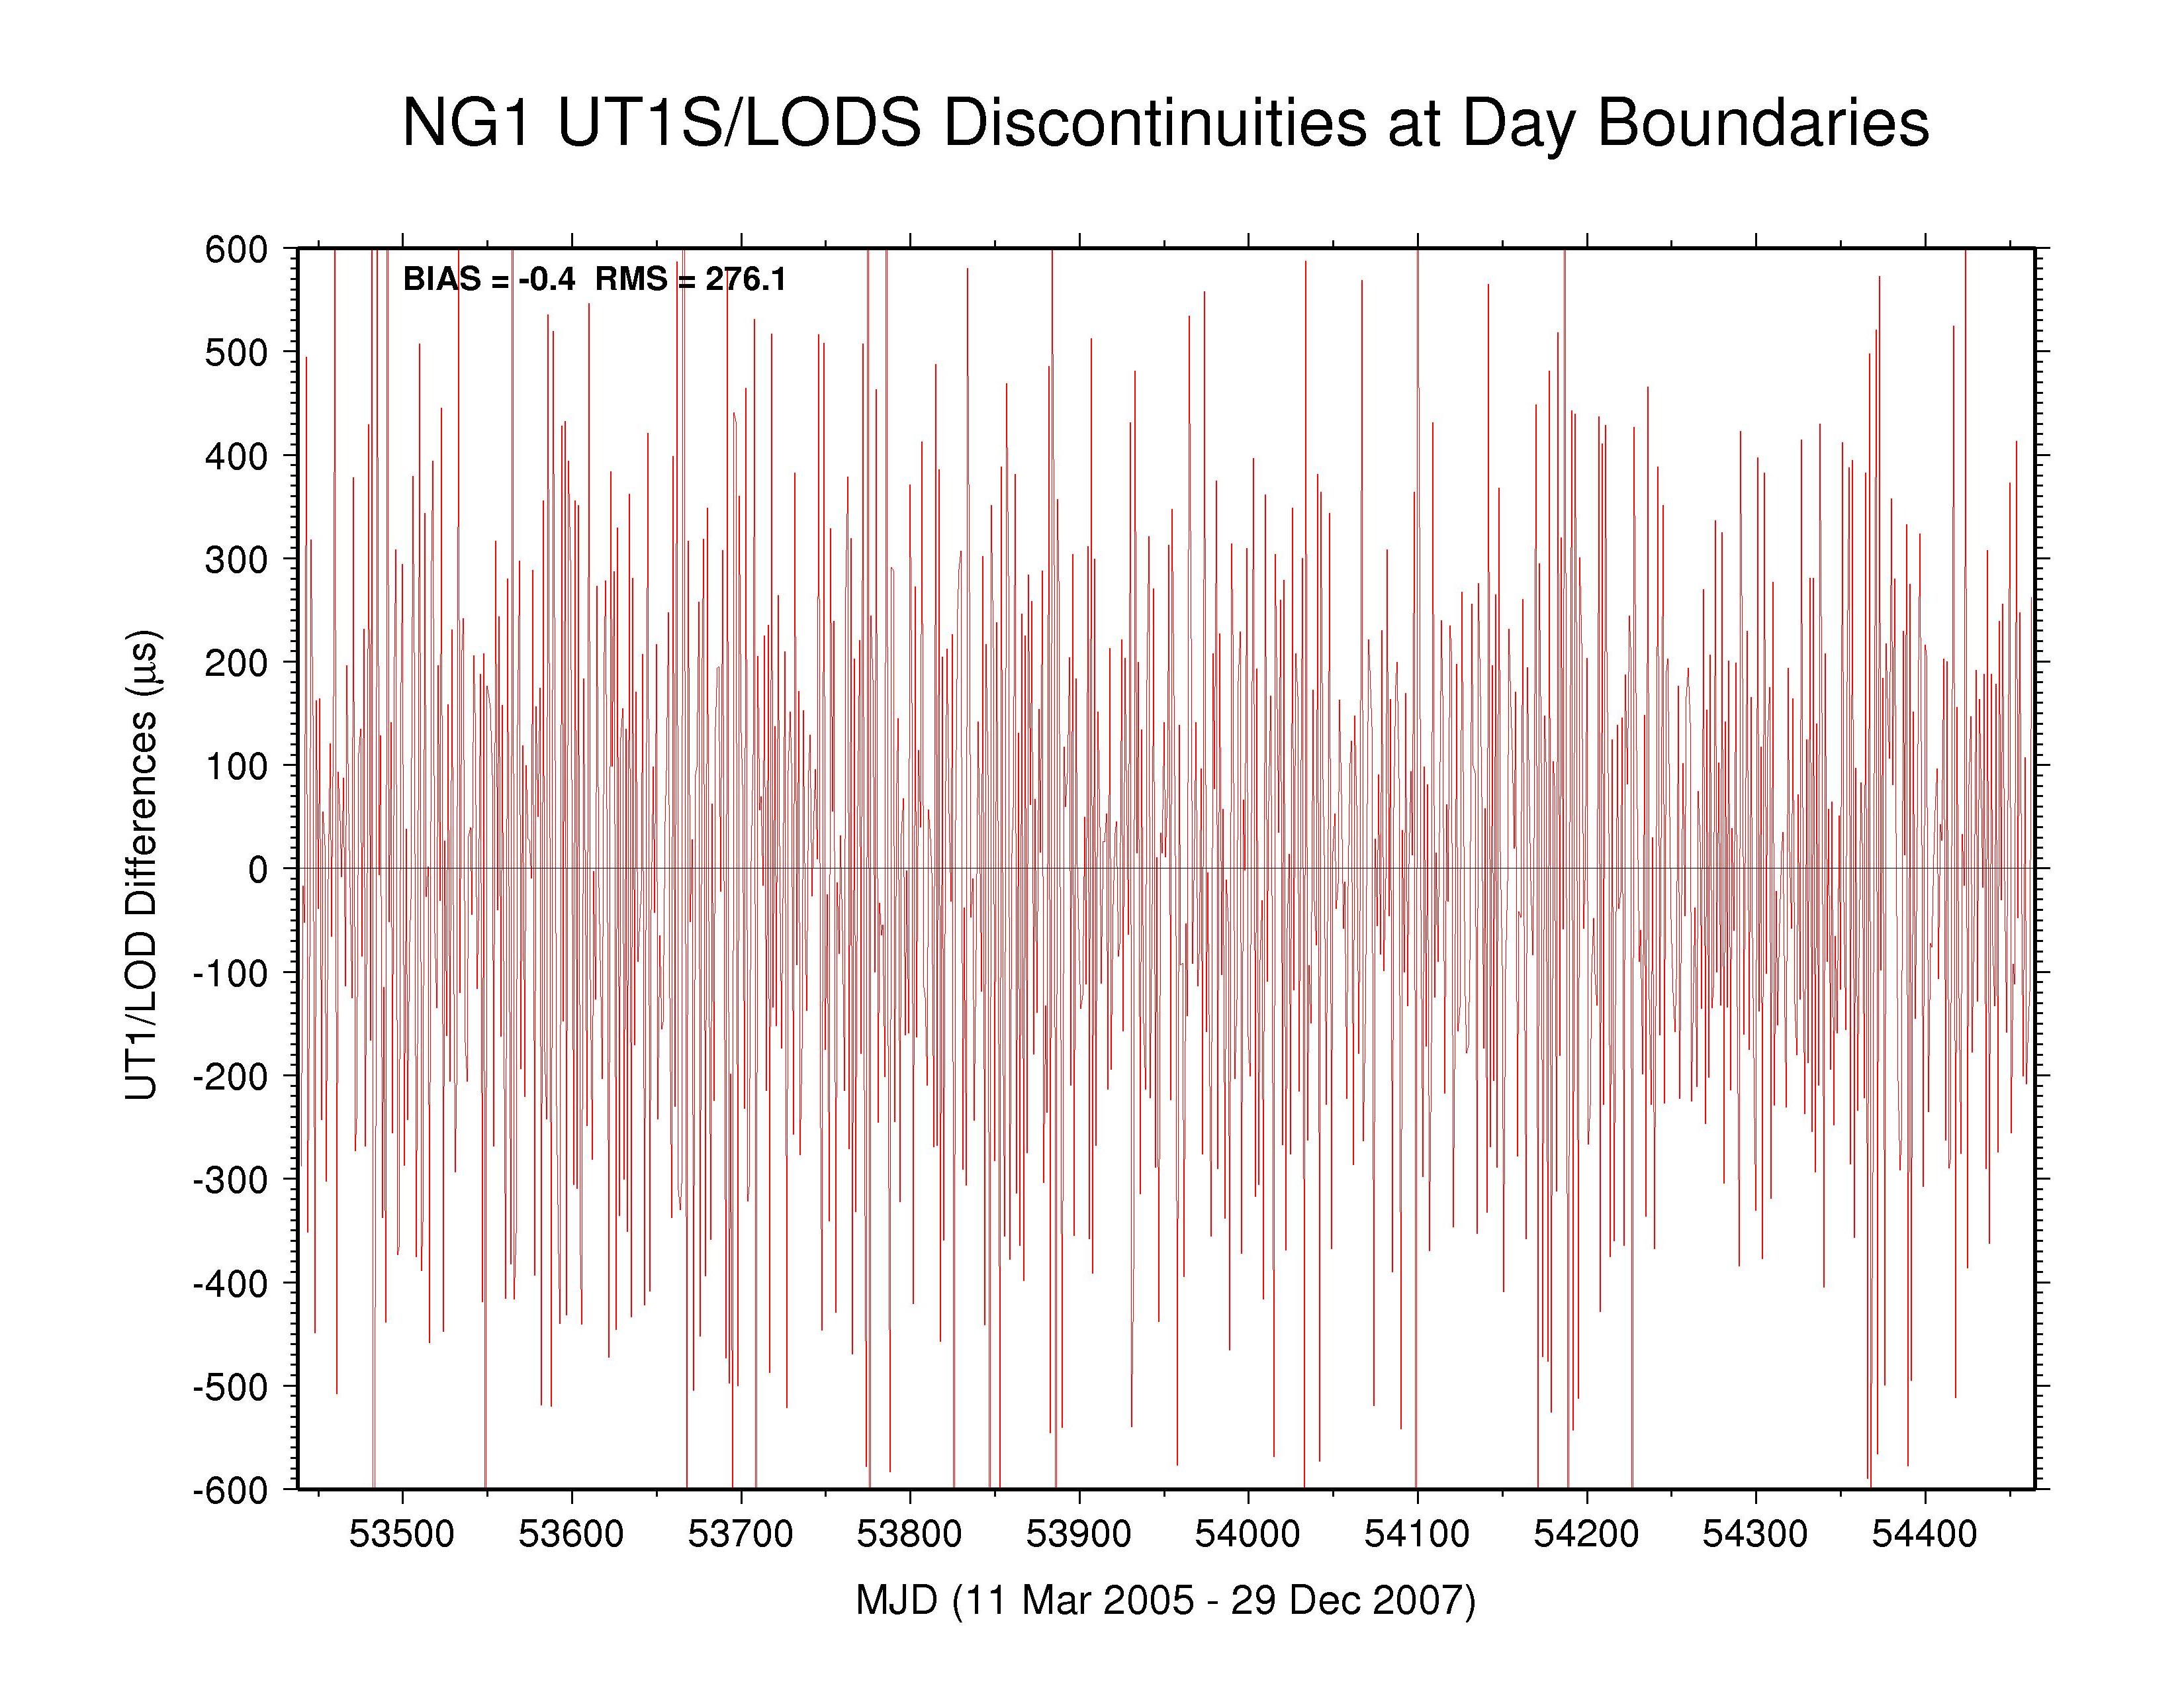
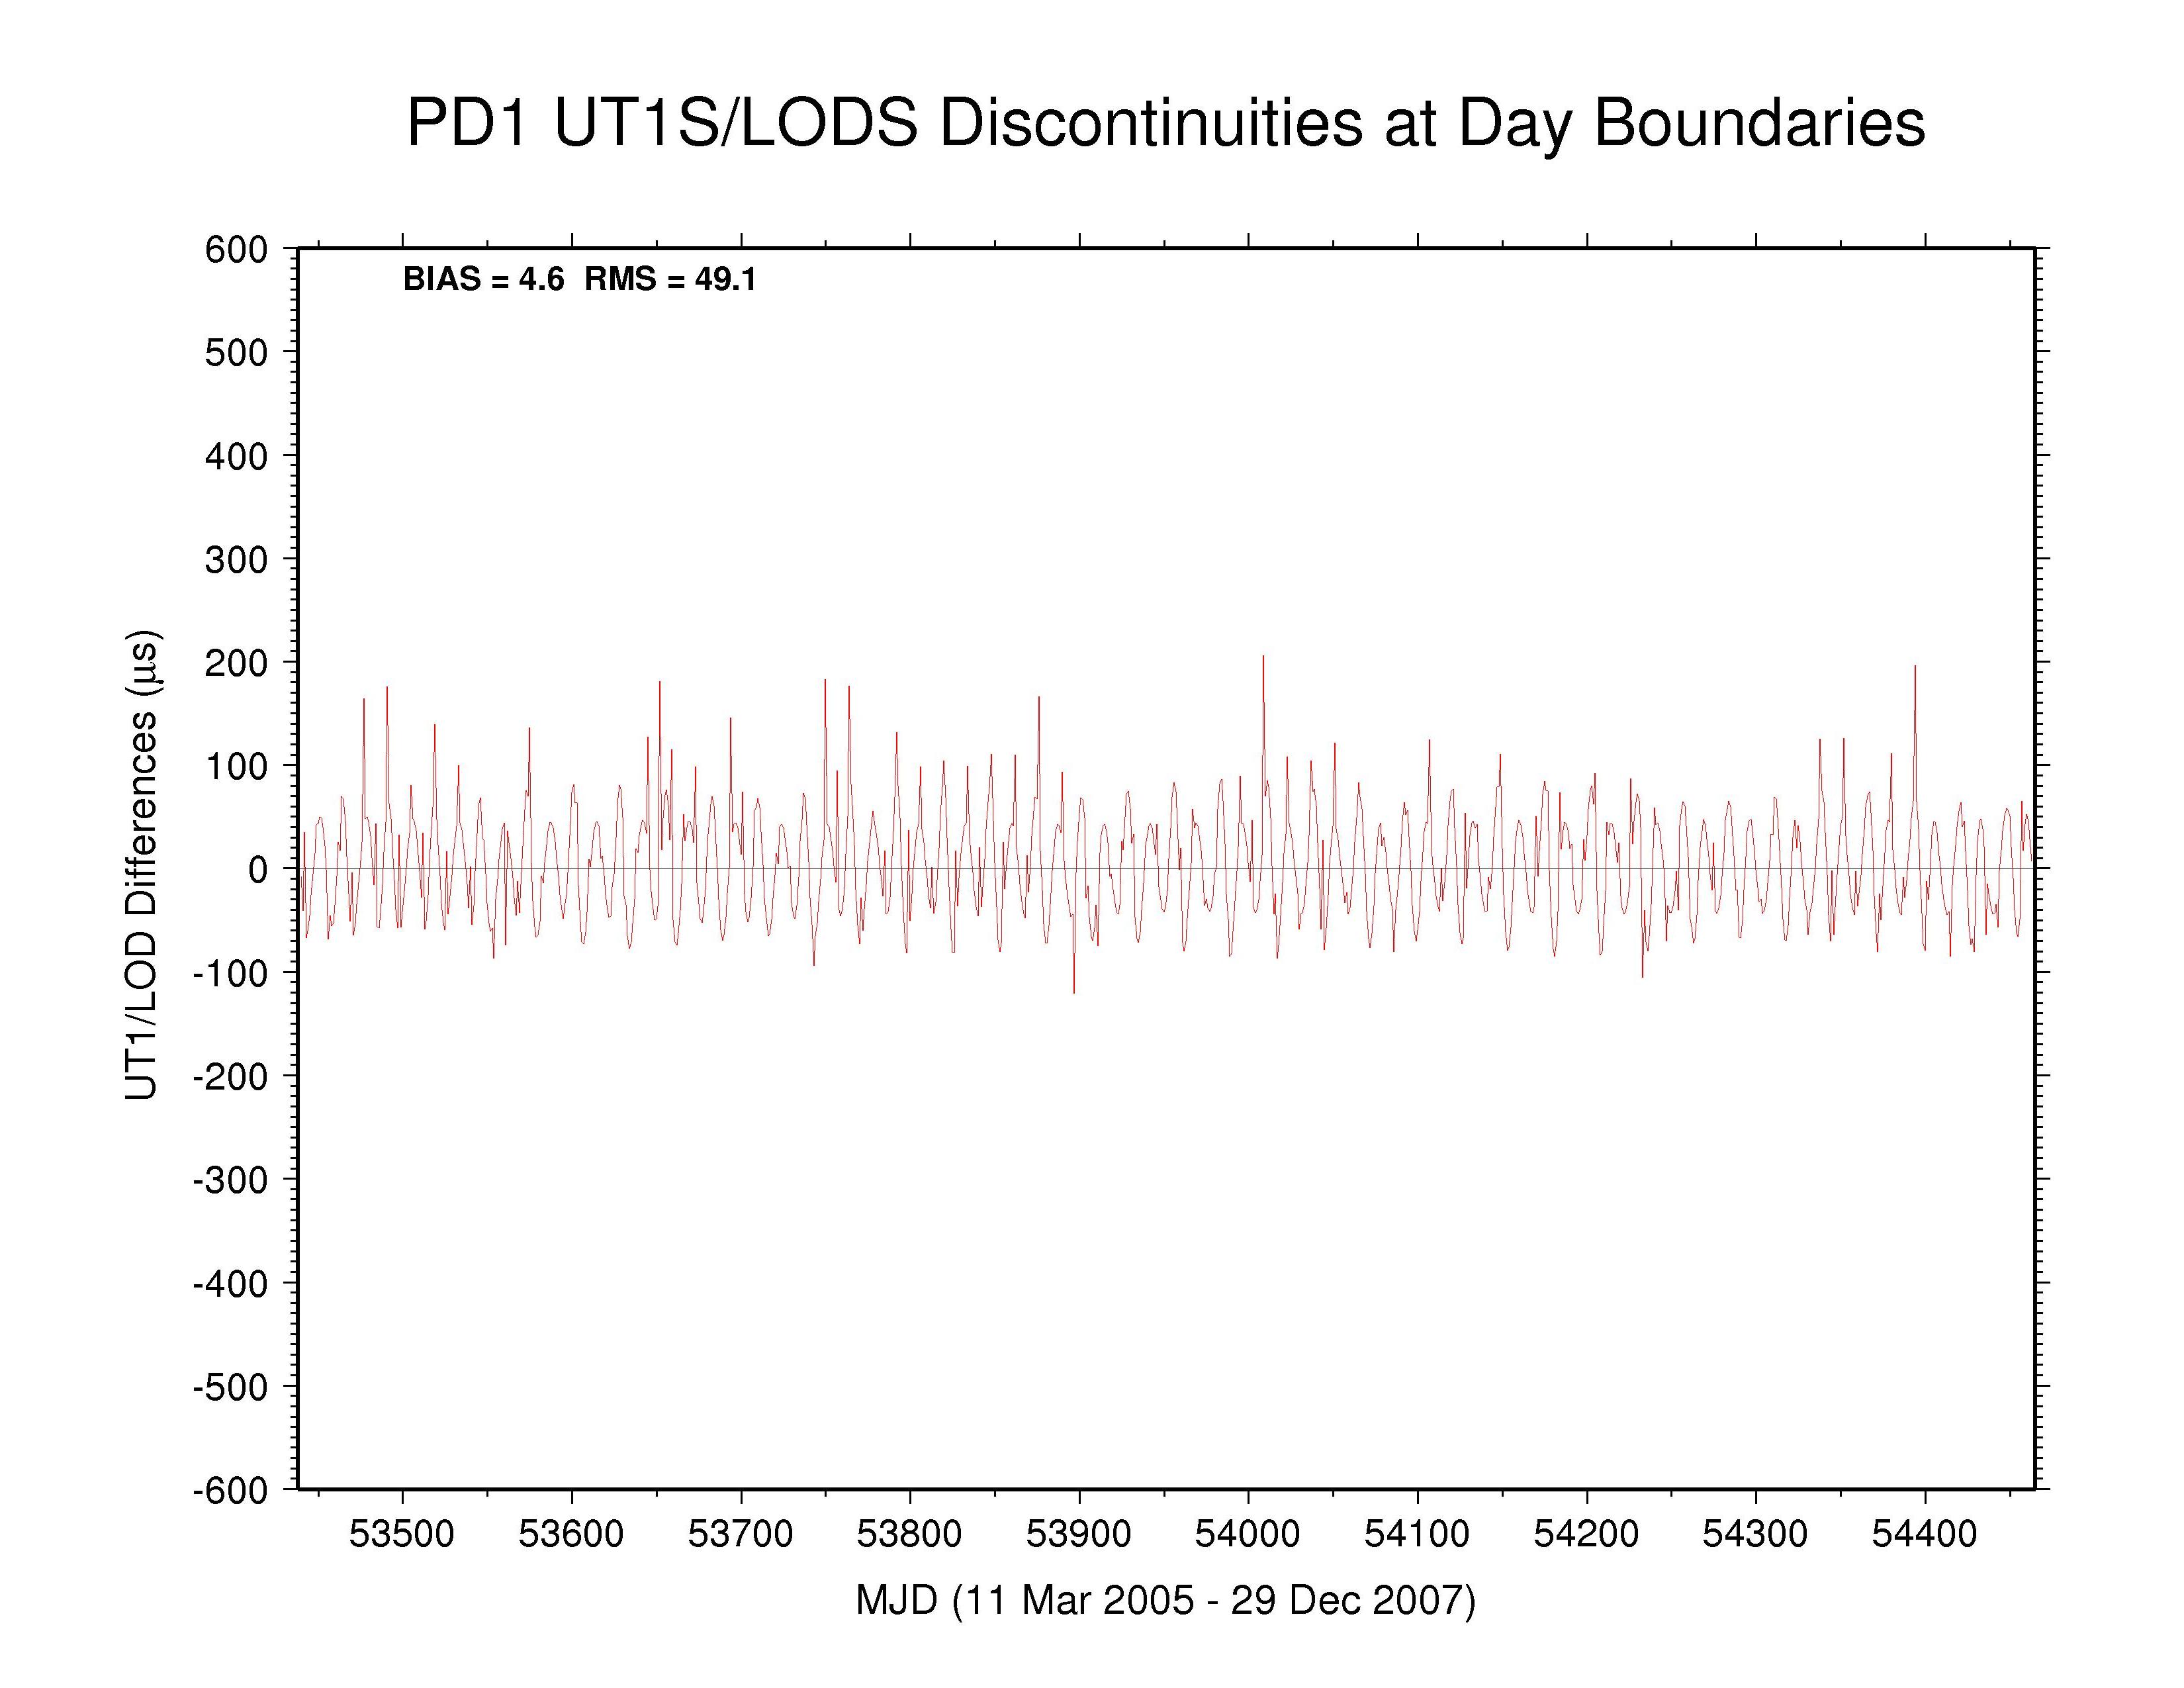
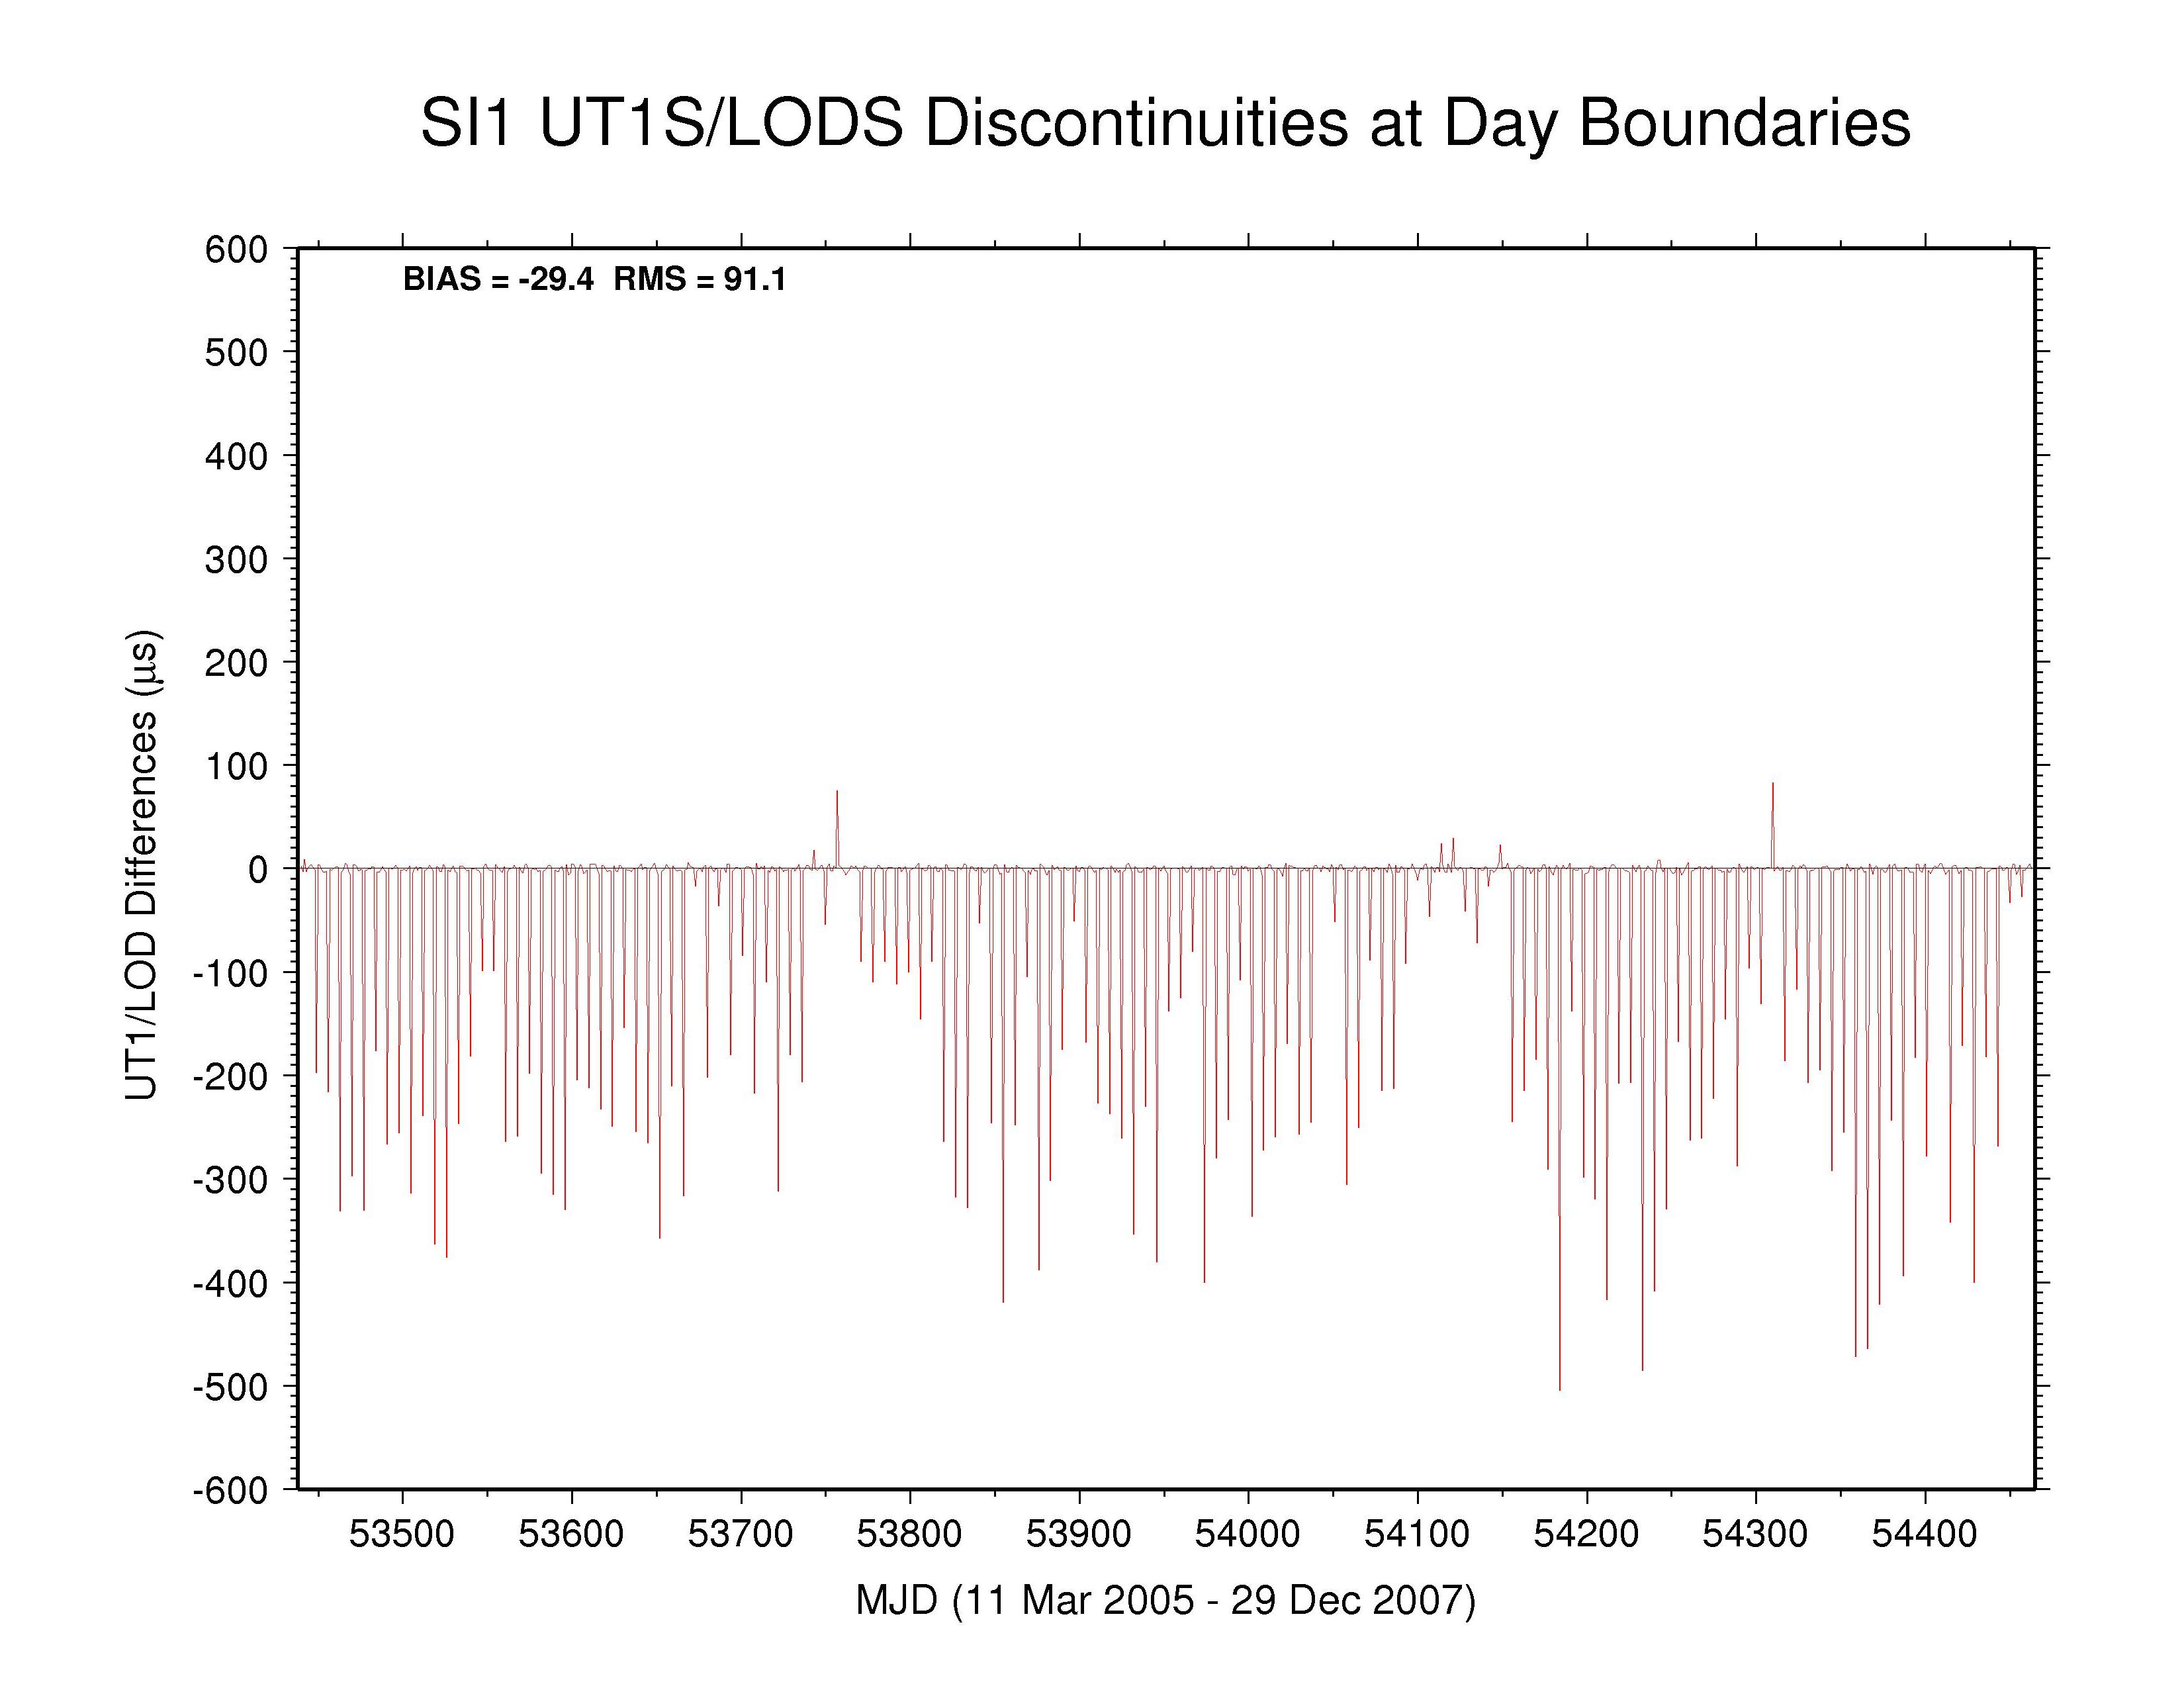
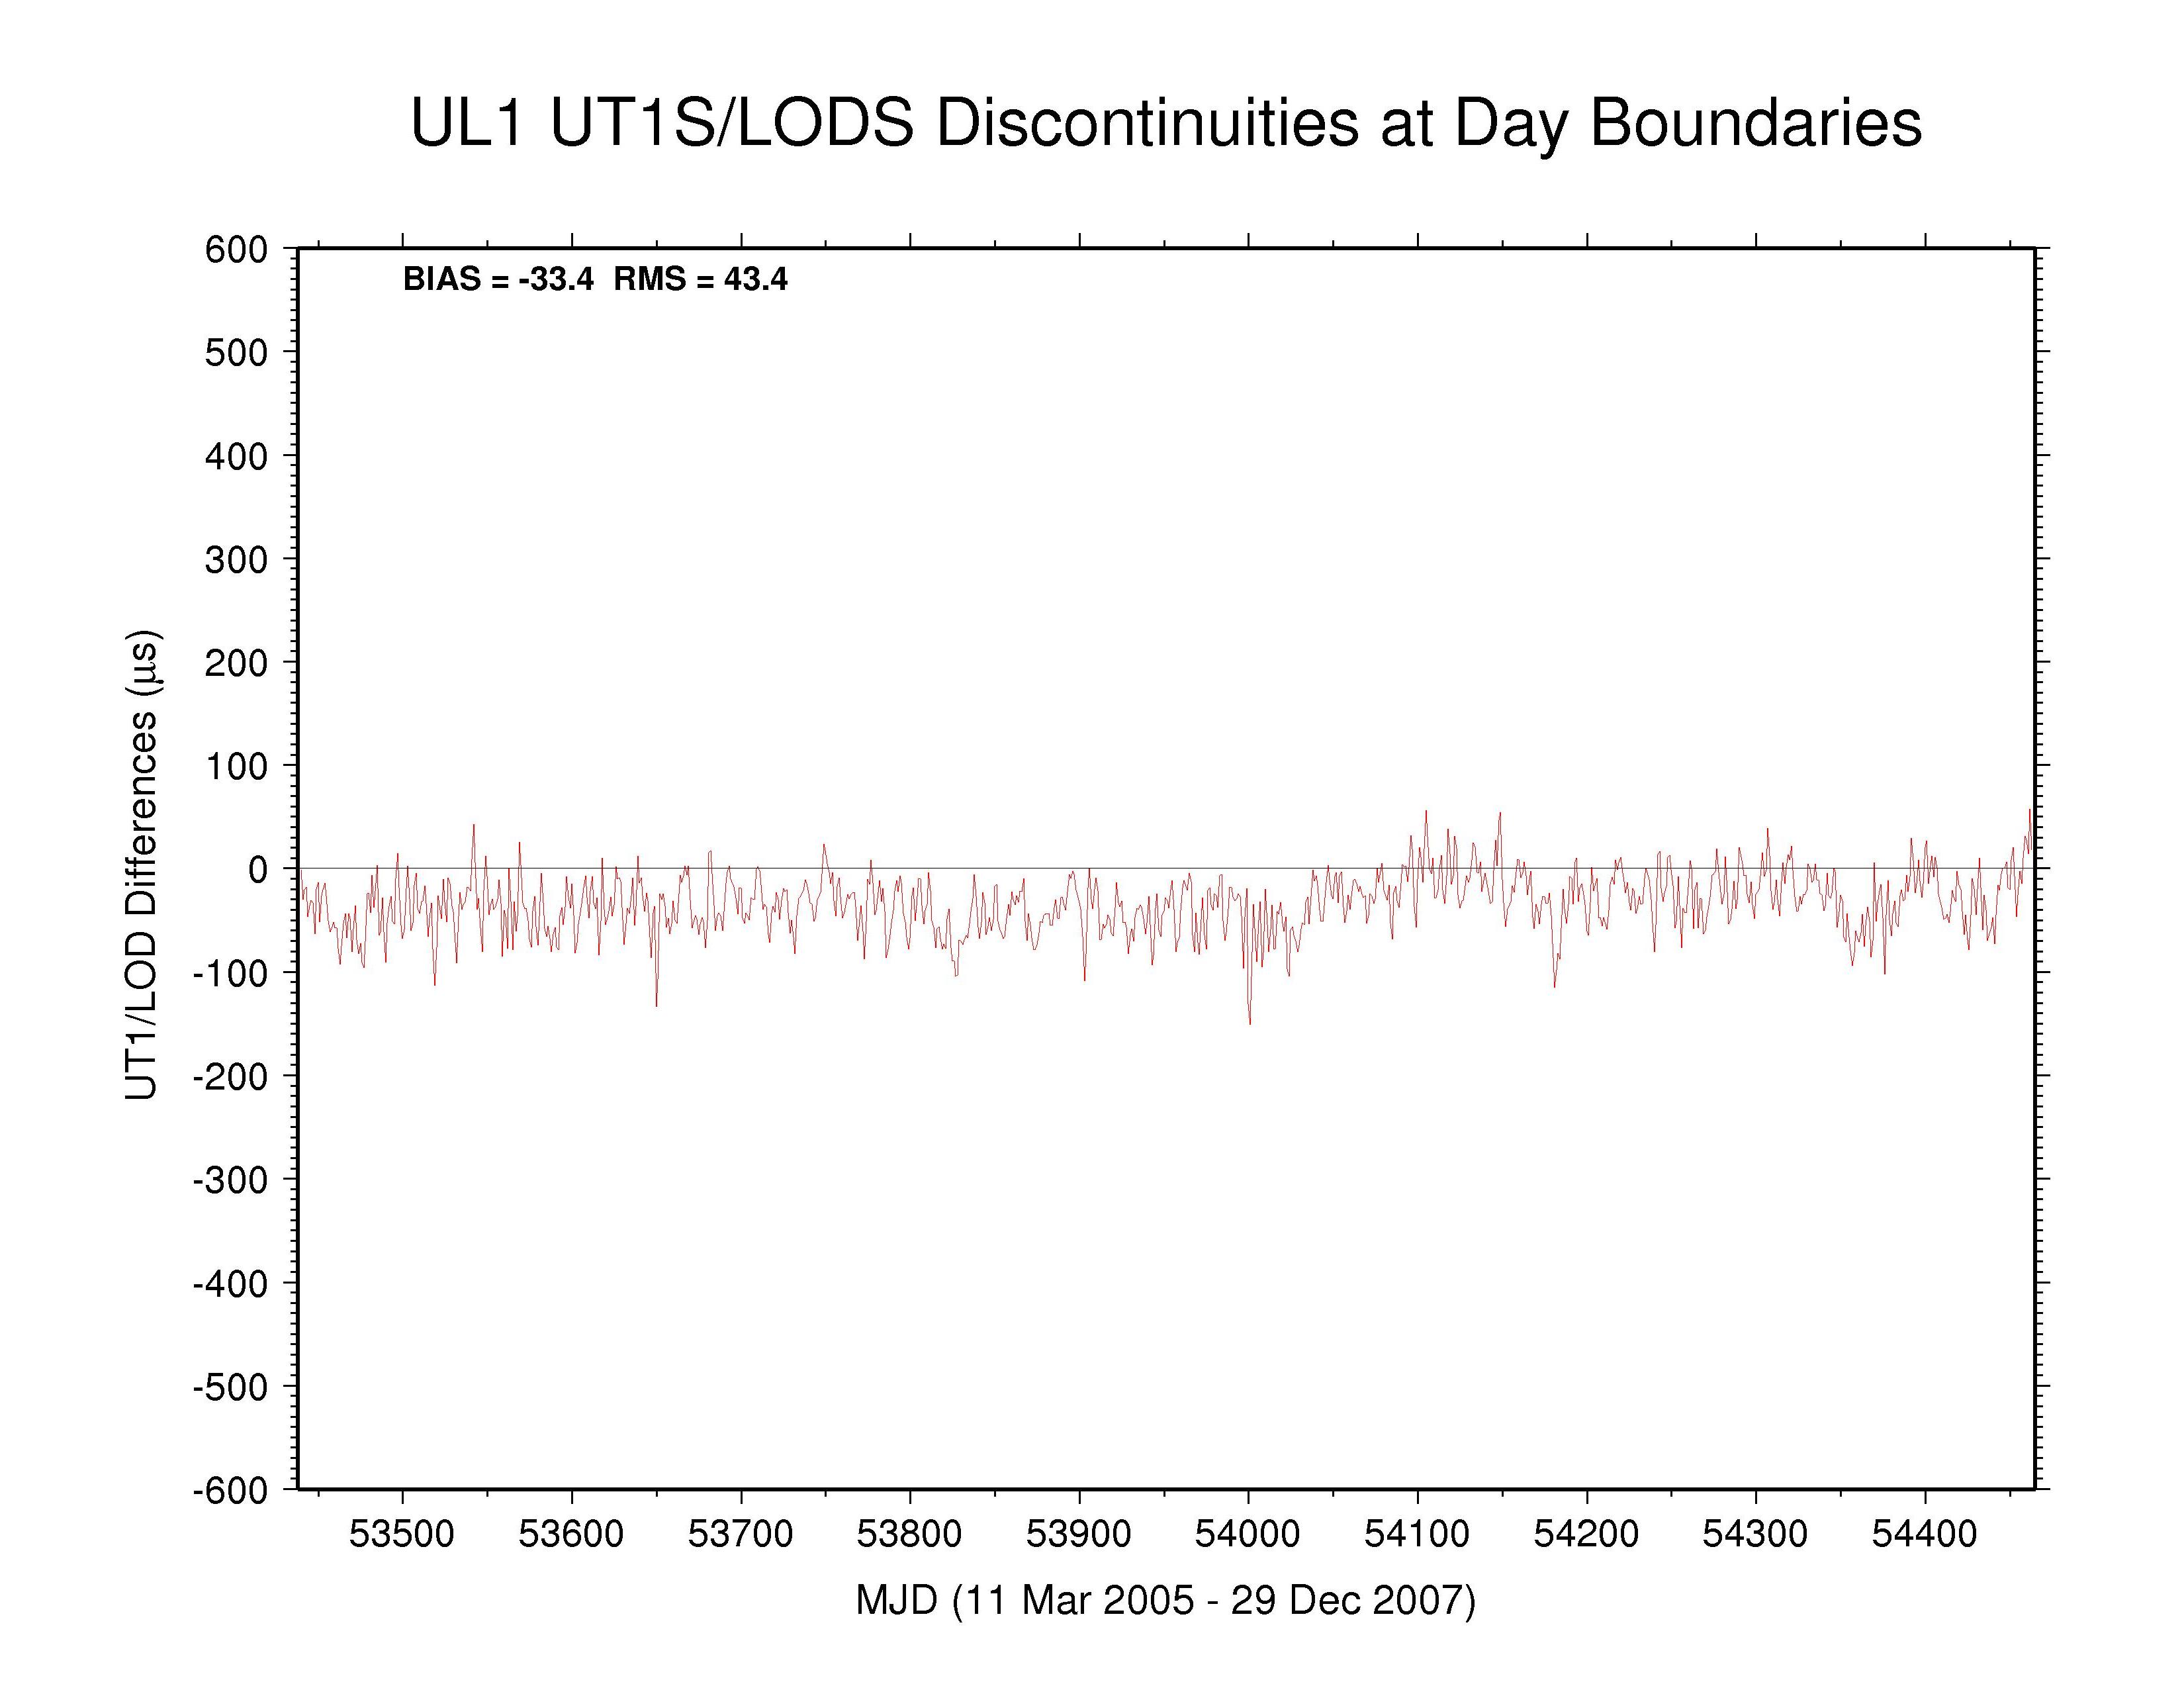
To more closely check the extent to which continuity conditions have been imposed on the LOD parameters between days (and for other reasons), the discontinuities in the UT1S/LODS time series have been computed at day boundaries and plotted below. The differences at each midnight epoch were found by [UT1S(day2) + (0.5*LODS(day2))] - [UT1S(day1) - (0.5*LODS(day1))] for each successive pair of days, day1 and day2. (Note that LODS is effectively the negative of dUT1S/dt for 24-hr samples.) On each plot is also shown the (unweighted) mean bias and RMS for each AC, as well as for the IGS combination. It should be noted again that the UT1 and LOD values used here are those from the respective ERP files. If any removable ERP constraints have been reported in the AC SINEX files, which are the source of official estimates, those have not been accounted for here.
 IGS —
ps file IGS —
ps file
|
 CODE —
ps file CODE —
ps file
|
 EMR —
ps file EMR —
ps file
|
 ESA —
ps file ESA —
ps file
|
 GFZ —
ps file GFZ —
ps file
|
 GTZ —
ps file GTZ —
ps file
|
 JPL —
ps file JPL —
ps file
|
 MIT —
ps file MIT —
ps file
|
 NGS —
ps file NGS —
ps file
|
 PDR —
ps file PDR —
ps file
|
 SIO —
ps file SIO —
ps file
|
 ULR —
ps file ULR —
ps file
|
The UT1S/LODS day-boundary discontinuities are much more difficult to interpret than the corresponding polar motion discontinuities. Because the polar motion offsets and rates are both estimated freely and in a fully self-consistent way, their discontinuities afford insights into the data modeling and processing. The same is not true for UT1/LOD because UT1 is not observable by satellite methods due to direct correlation with the orbit node parameters that must also be estimated simultaneously. Some constraint must be applied to fix UT1 at some epoch and variations in UT1 (equivalent to LOD) determined at other epochs relative to the fixed epoch.
The wide diversity of UT1S/LODS discontinuity results shown above demonstrates that the ACs handle UT1 fixation in many different ways. The AC analysis strategy summaries generally do not provide sufficient details about the individual procedures used in this respect. But we can try to infer characteristics of the approaches used by some ACs from the observed behavior of their UT1S/LODS discontinuities.
Unlike for polar motion, the UT1S/LODS discontinuities do not usually reflect almost entirely the behavior of the rate (i.e., LOD) estimates only. In most cases, the choice for UT1 fixation will also enter into the discontinuities. This situation can be avoided in only two cases: 1) if UT1 is fixed at some initial epoch then LOD can be estimated daily thereafter provided that LOD continuity is imposed between all successive days; or 2) if UT1 is fixed at some initial epoch then UT1 and LOD can be estimated daily thereafter provided that continuity in the orbit nodes is imposed between all successive days. In both circumstances, the UT1 and LOD estimates will be self-consistent and the UT1S/LODS discontinuities will provide some measure of the LOD measurement noise. However, neither approach allows truly free, unconstrained LOD estimates to be obtained. From the behavior of their discontinuities, we are tempted to speculate that ESA, JPL, and ULR use the first type of fixation strategy while EMR probably uses the second type. However, this is not the case for ESA (Tim Springer, private communication March 2009), which fixes UT1 at the middle of each day and freely adjusts LOD. The ULR discontinuities show a long-term persistent bias as if the LOD estimates are biased by perhaps some correlated orbit node bias. The CODE discontinuities are consistent with imposition of a strict day-to-day continuity condition; the weekly modulation is the effect of extracting the middle 7 days from their 9-day ERP files.
A modification of the first fixation strategy is to fix UT1 at the start of each GPS week and to maintain LOD continuity thereafter for that week. When following this method, any inconsistencies among the fixed weekly UT1 values and with the estimated LOD values will enter into the UT1S/LODS discontinuities. One expects any such UT1 inconsistencies to be greatest at the week boundaries. A better approach would be to avoid tight constraints on the LOD continuity and permit nearly free daily adjustments. Evidently GFZ, GTZ, MIT, and SIO use methods of this general type as evidenced by the sharp weekly modulation of their discontinuities. In this case the level of UT1S/LODS discontinuities is related to the UT1 resets at the start of each week and the general consistency of the reported UT1 values with the associated LOD estimates. Between their weekly resets, the MIT discontinuities are nearly zero because the MIT reported UT1 values are derived by integration from the LOD estimates (Tom Herring, private communication March 2009).
PDR probably also uses a generally similar approach but their UT1 fixation produces much less obvious weekly discontinuity spikes compared to the other ACs. NGS fixes UT1 to IERS Bulletin A values at the start of each day separately and estimates each daily LOD parameter freely and independently. The NGS LODS power spectrum follows a constant high-frequency slope more closely than most of the other ACs, but their UT1S/LODS discontinuities are greatly increased by the resulting inconsistency of their UT1 and LOD estimates, which should otherwise be inconsequential. In principle, other styles of UT1 fixation could be used as well.
Apart from the general characteristics described above, the GFZ and GTZ discontinuities show patterns of periodic changes in analysis strategy or constraint level. That is also seen in the formal errors of their ERP estimates, which shift dramatically in level from time to time. The behavior of the SIO discontinuities is particularly odd in that their weekly spikes are nearly entirely one-sided. It is not clear what might cause this.
Mean bias and RMS values (unweighted) are tabulated below for each UT1S/LODS time series. As discussed above, the values cannot be simply interpreted.
| Statistics of Day-boundary UT1S/LODS Discontinuities | |||||
| AC | UT1S/LODS (µs) | Remarks | |||
| bias | RMS | ||||
| IGS | 1.1 | 16.3 | multi-AC combination;
UT1 interpolated from Bull A; AC LOD bias corrections applied from 21-d comparison with Bull A |
||
| COD | 3.7 | 21.7 | initial UT1 value fixed weekly; strict LOD continuity imposed thereafter |
||
| EMR | -16.4 | 152.1 | orbit nodes contrained from day to day; UT1 & LOD freely estimated ??? |
||
| ESA | -4.5 | 17.0 | noon UT1 fixed daily to interpolated Bull A; daily LOD variations weakly constrained to 250 µs |
||
| GFZ | -6.0 | 156.5 | initial UT1 value fixed weekly; LOD continuity imposed thereafter ??? |
||
| GTZ | -12.3 | 138.9 | initial UT1 value fixed weekly; LOD continuity imposed thereafter ??? |
||
| JPL | -1.4 | 23.6 | initial UT1 value fixed; LOD continuity imposed thereafter ??? |
||
| MIT | -4.6 | 35.9 | initial UT1 value "fixed" weekly; daily LOD variations weakly constrained to 660 µs; consistent UT1 values from LOD integration |
||
| NGS | -0.4 | 276.1 | 00:00 UT1 value fixed daily to Bull A; LOD estimated freely each day |
||
| PDR | 4.6 | 49.1 | initial UT1 value constrained weekly; LOD continuity imposed thereafter ??? |
||
| SIO | -29.4 | 91.1 | initial UT1 value fixed weekly; LOD continuity imposed thereafter ??? |
||
| ULR | -33.4 | 43.4 | initial UT1 value fixed from interpolated Bull B; daily LOD variations very weakly constrained to 20 ms |
||
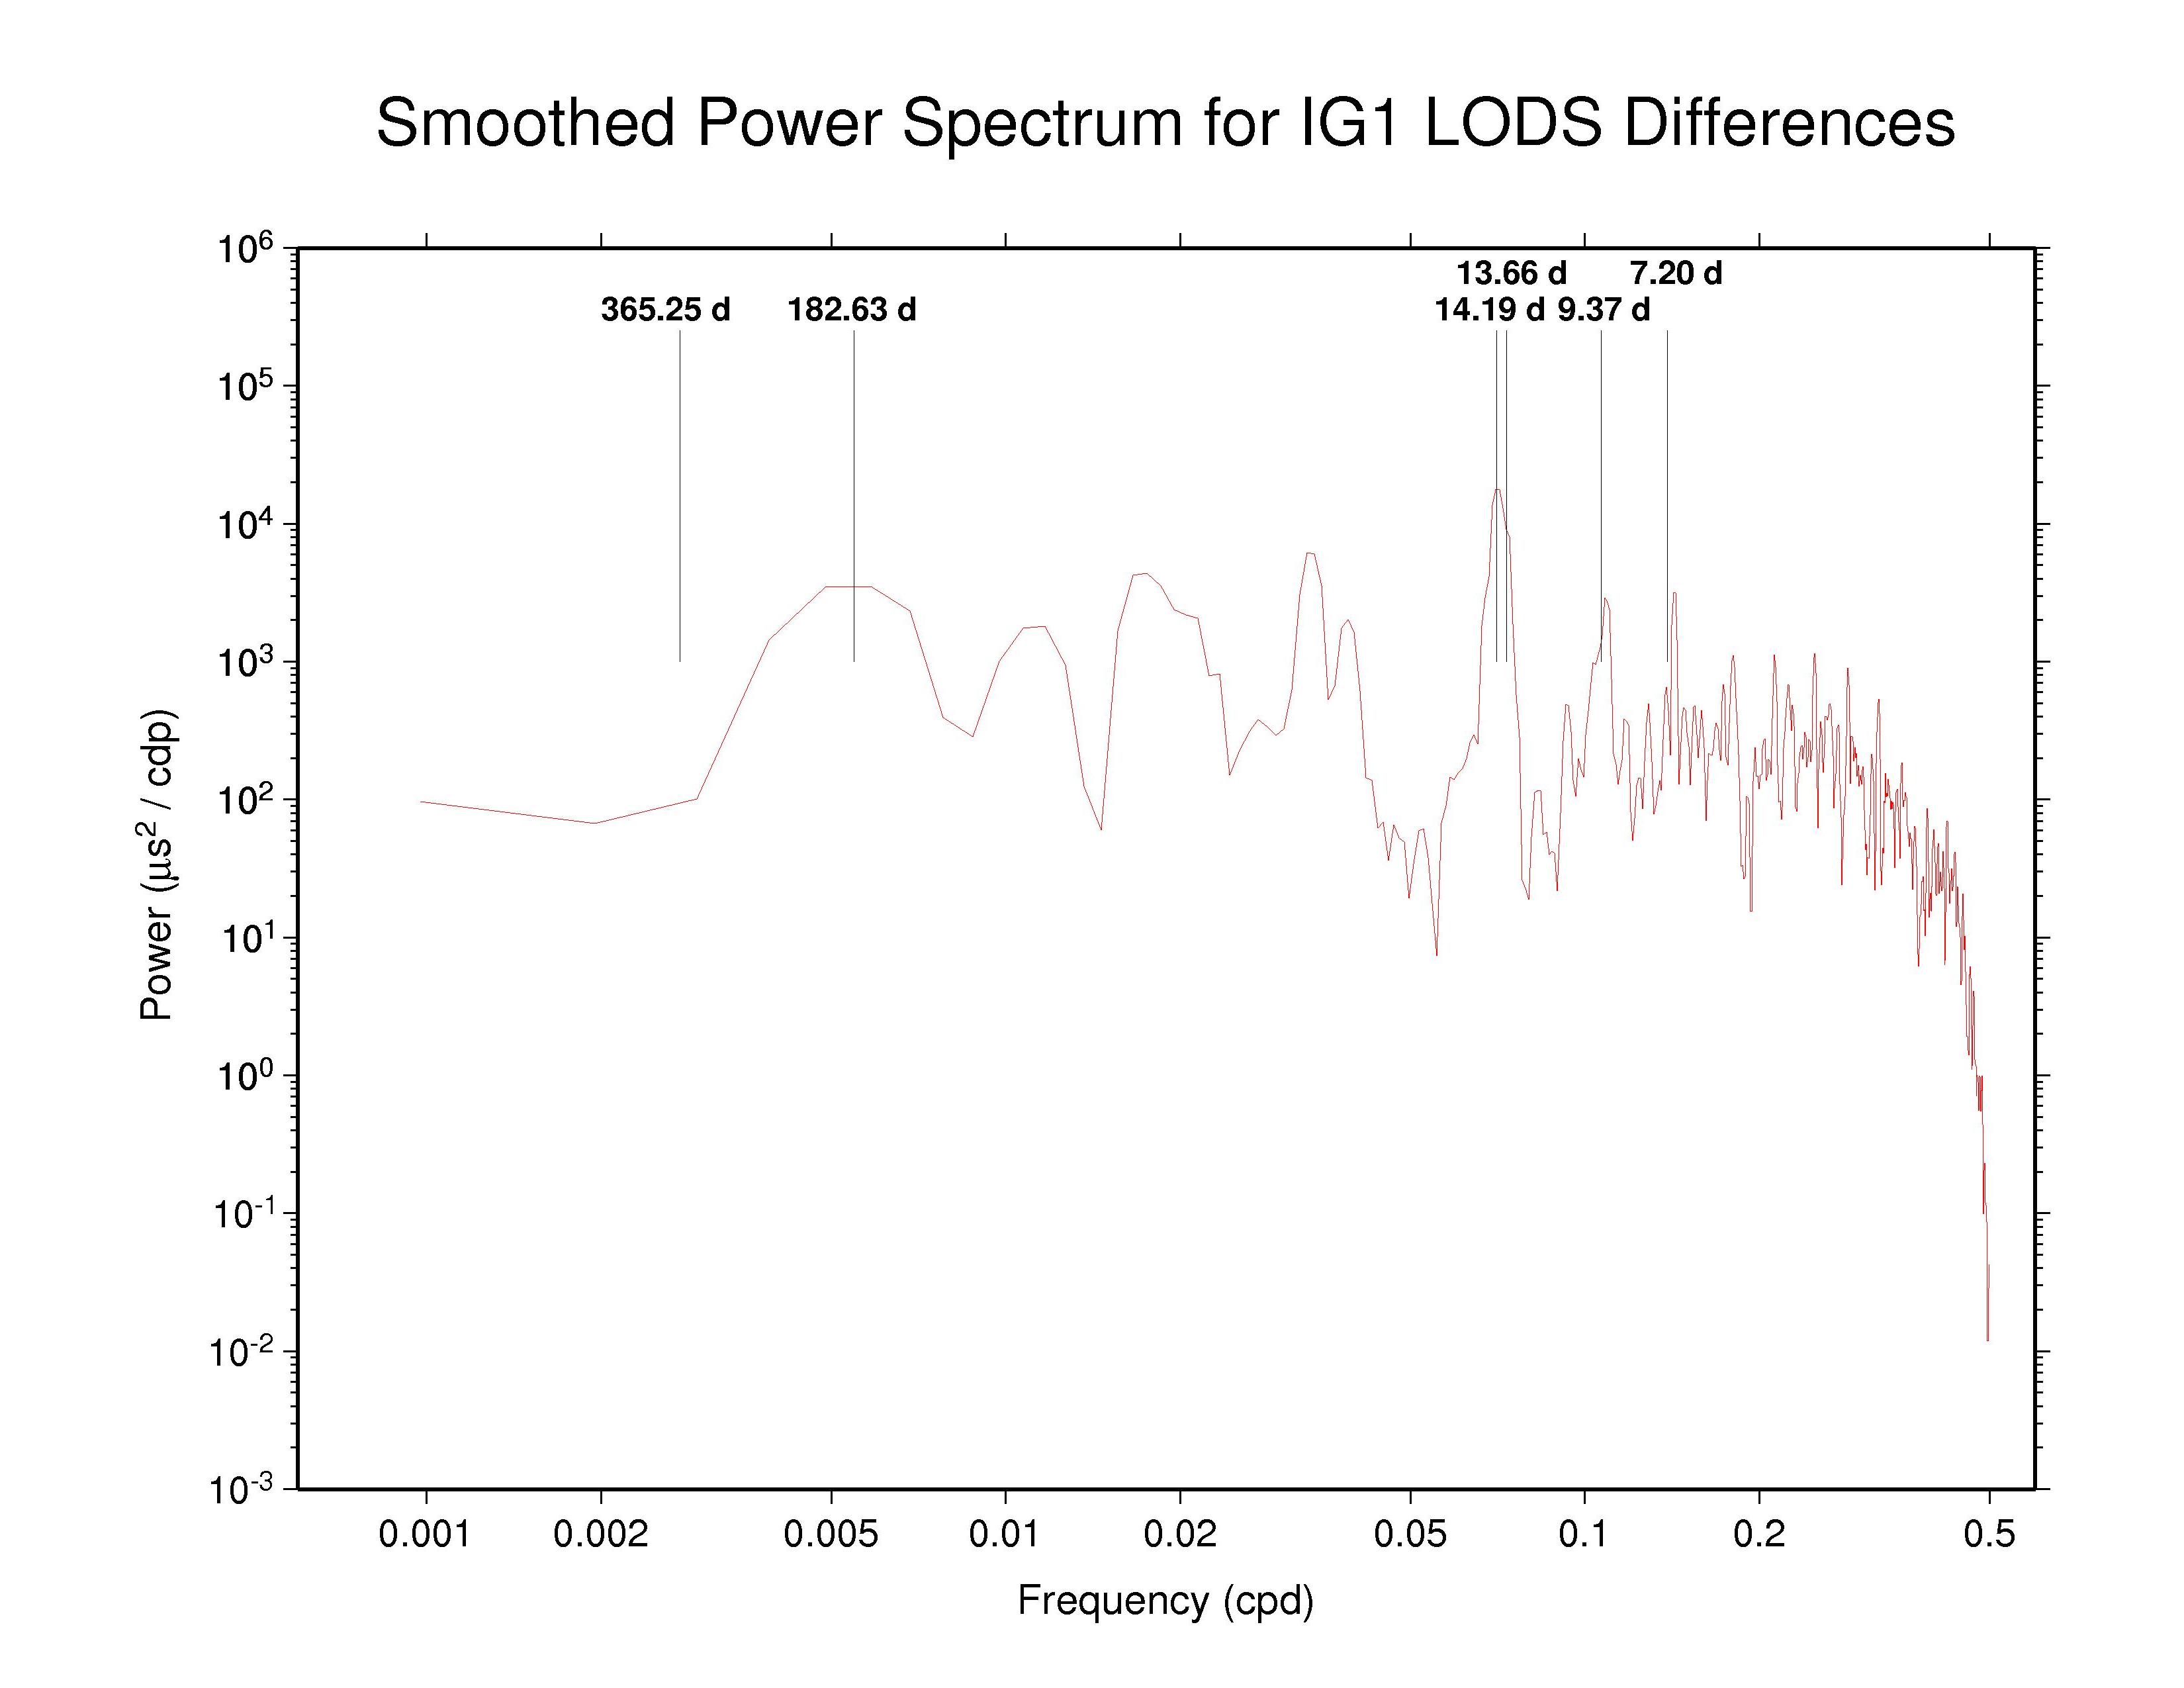
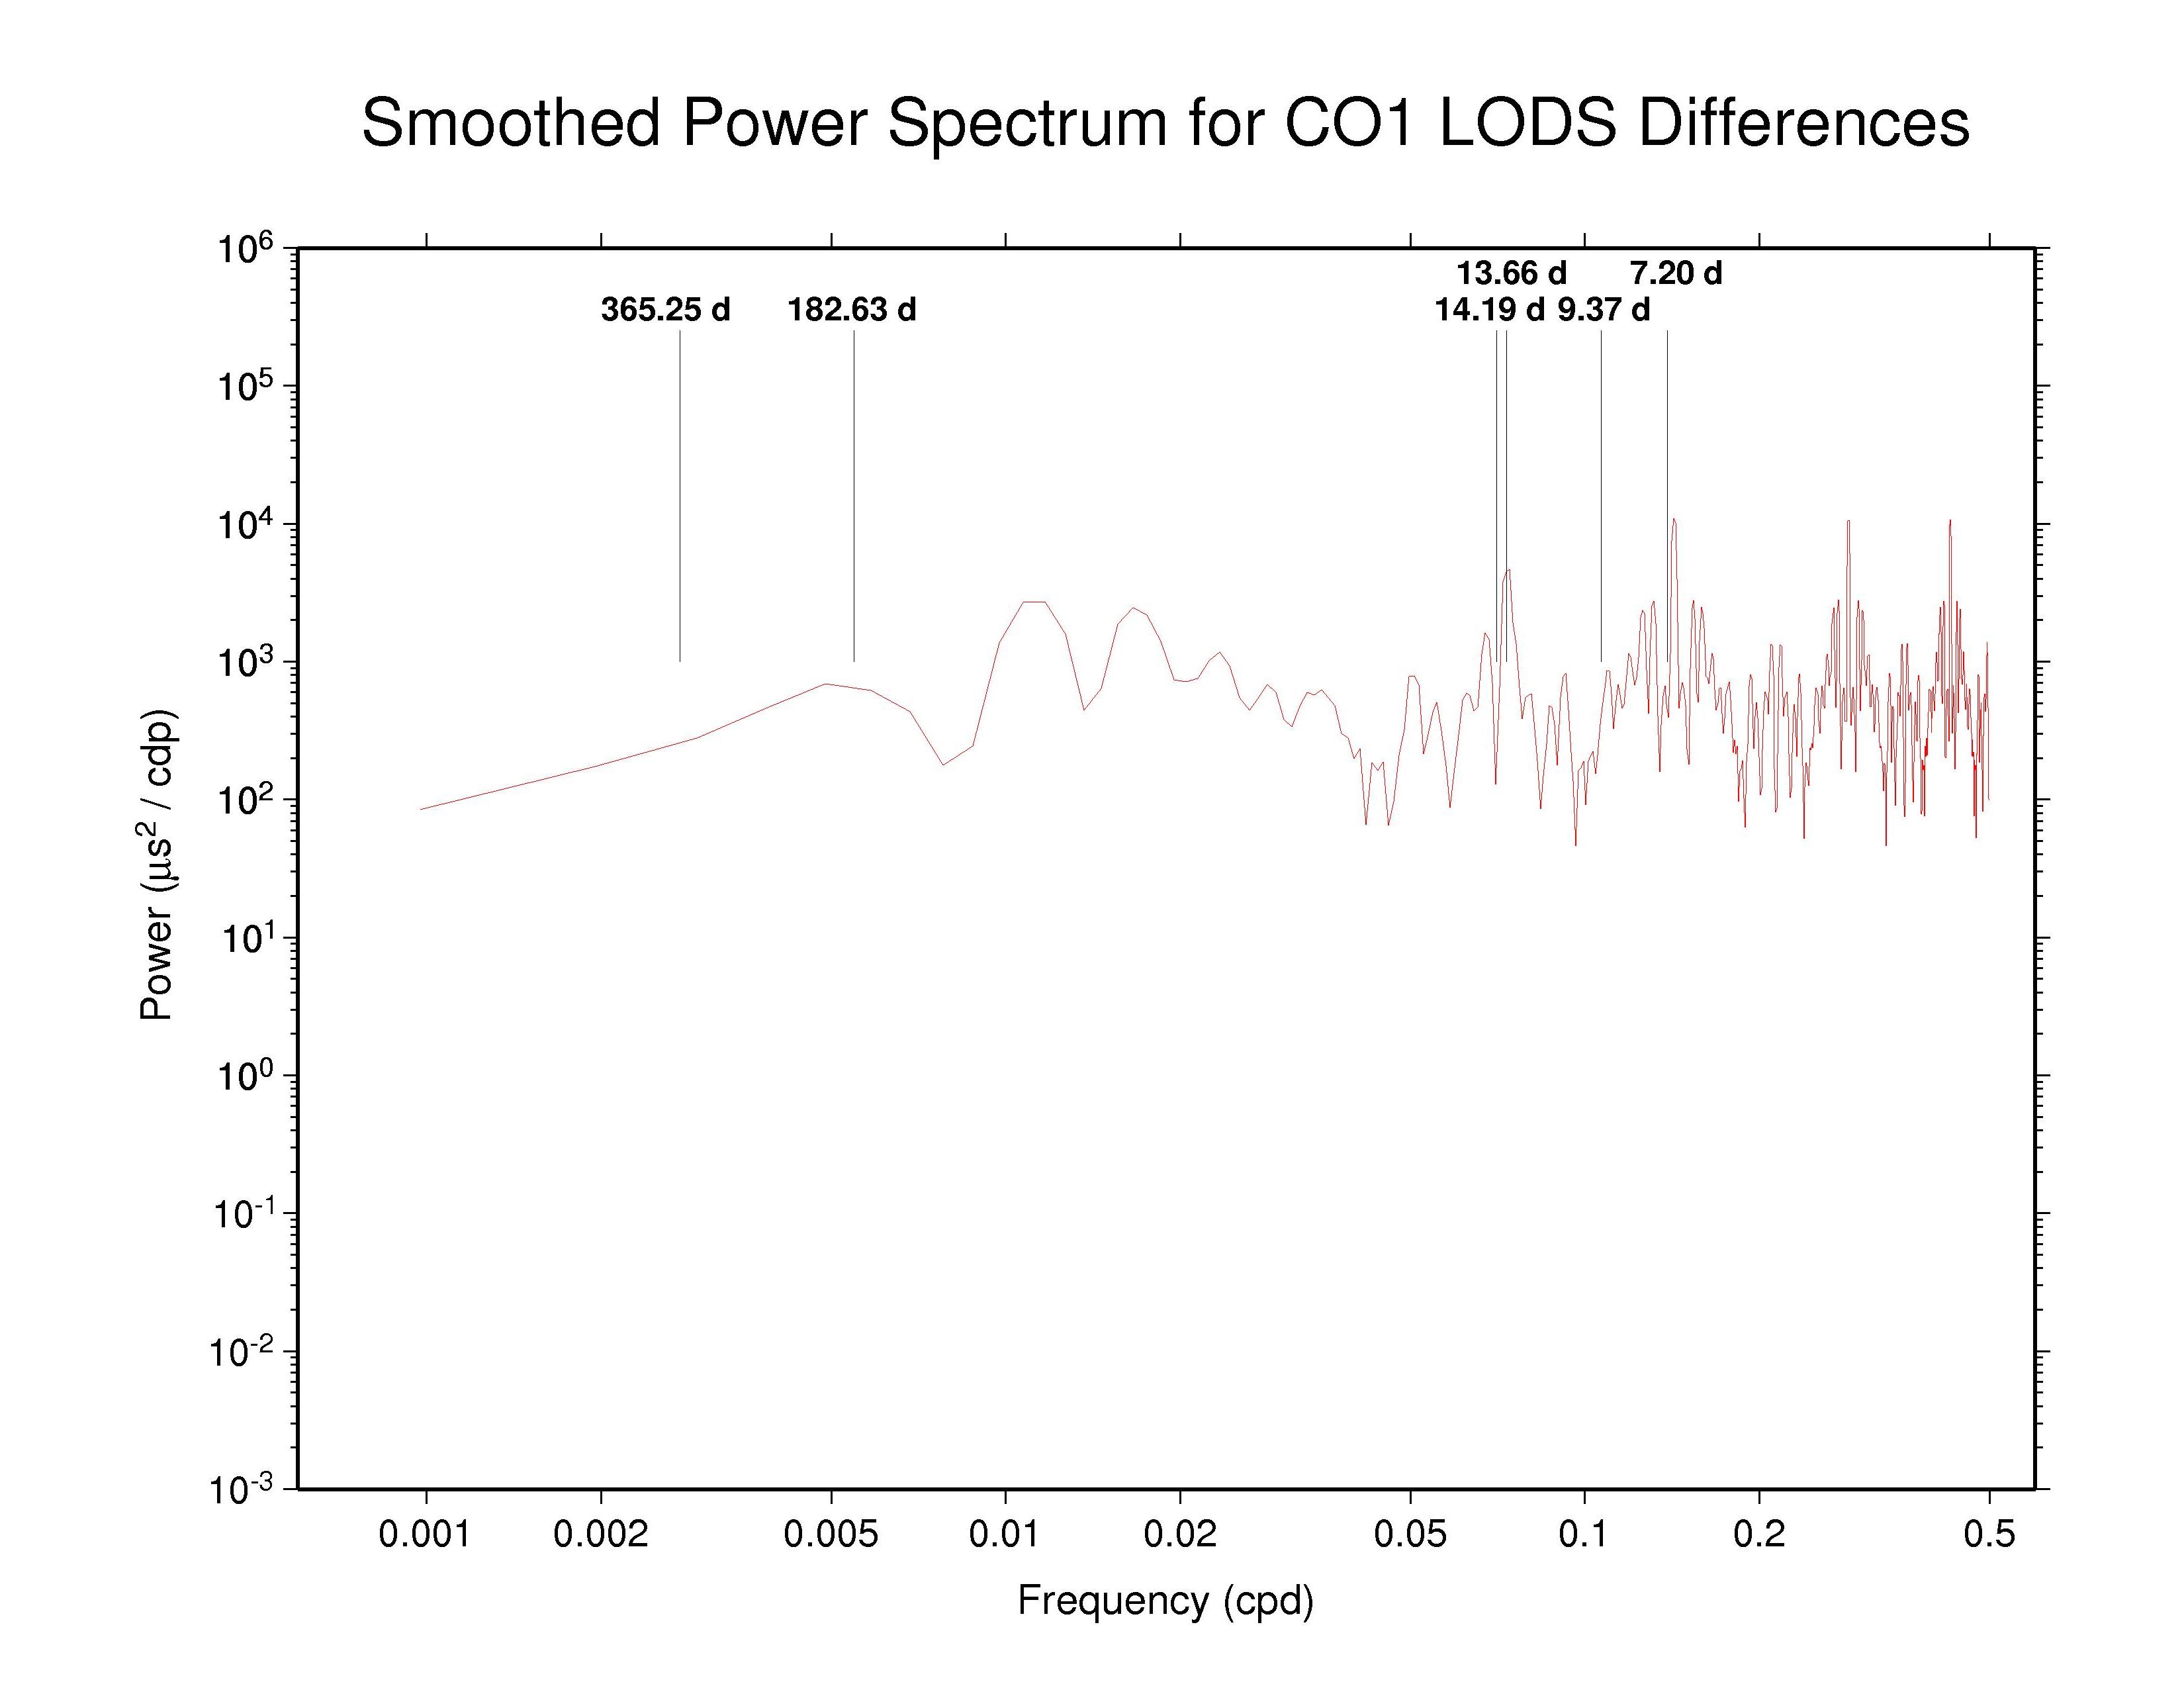
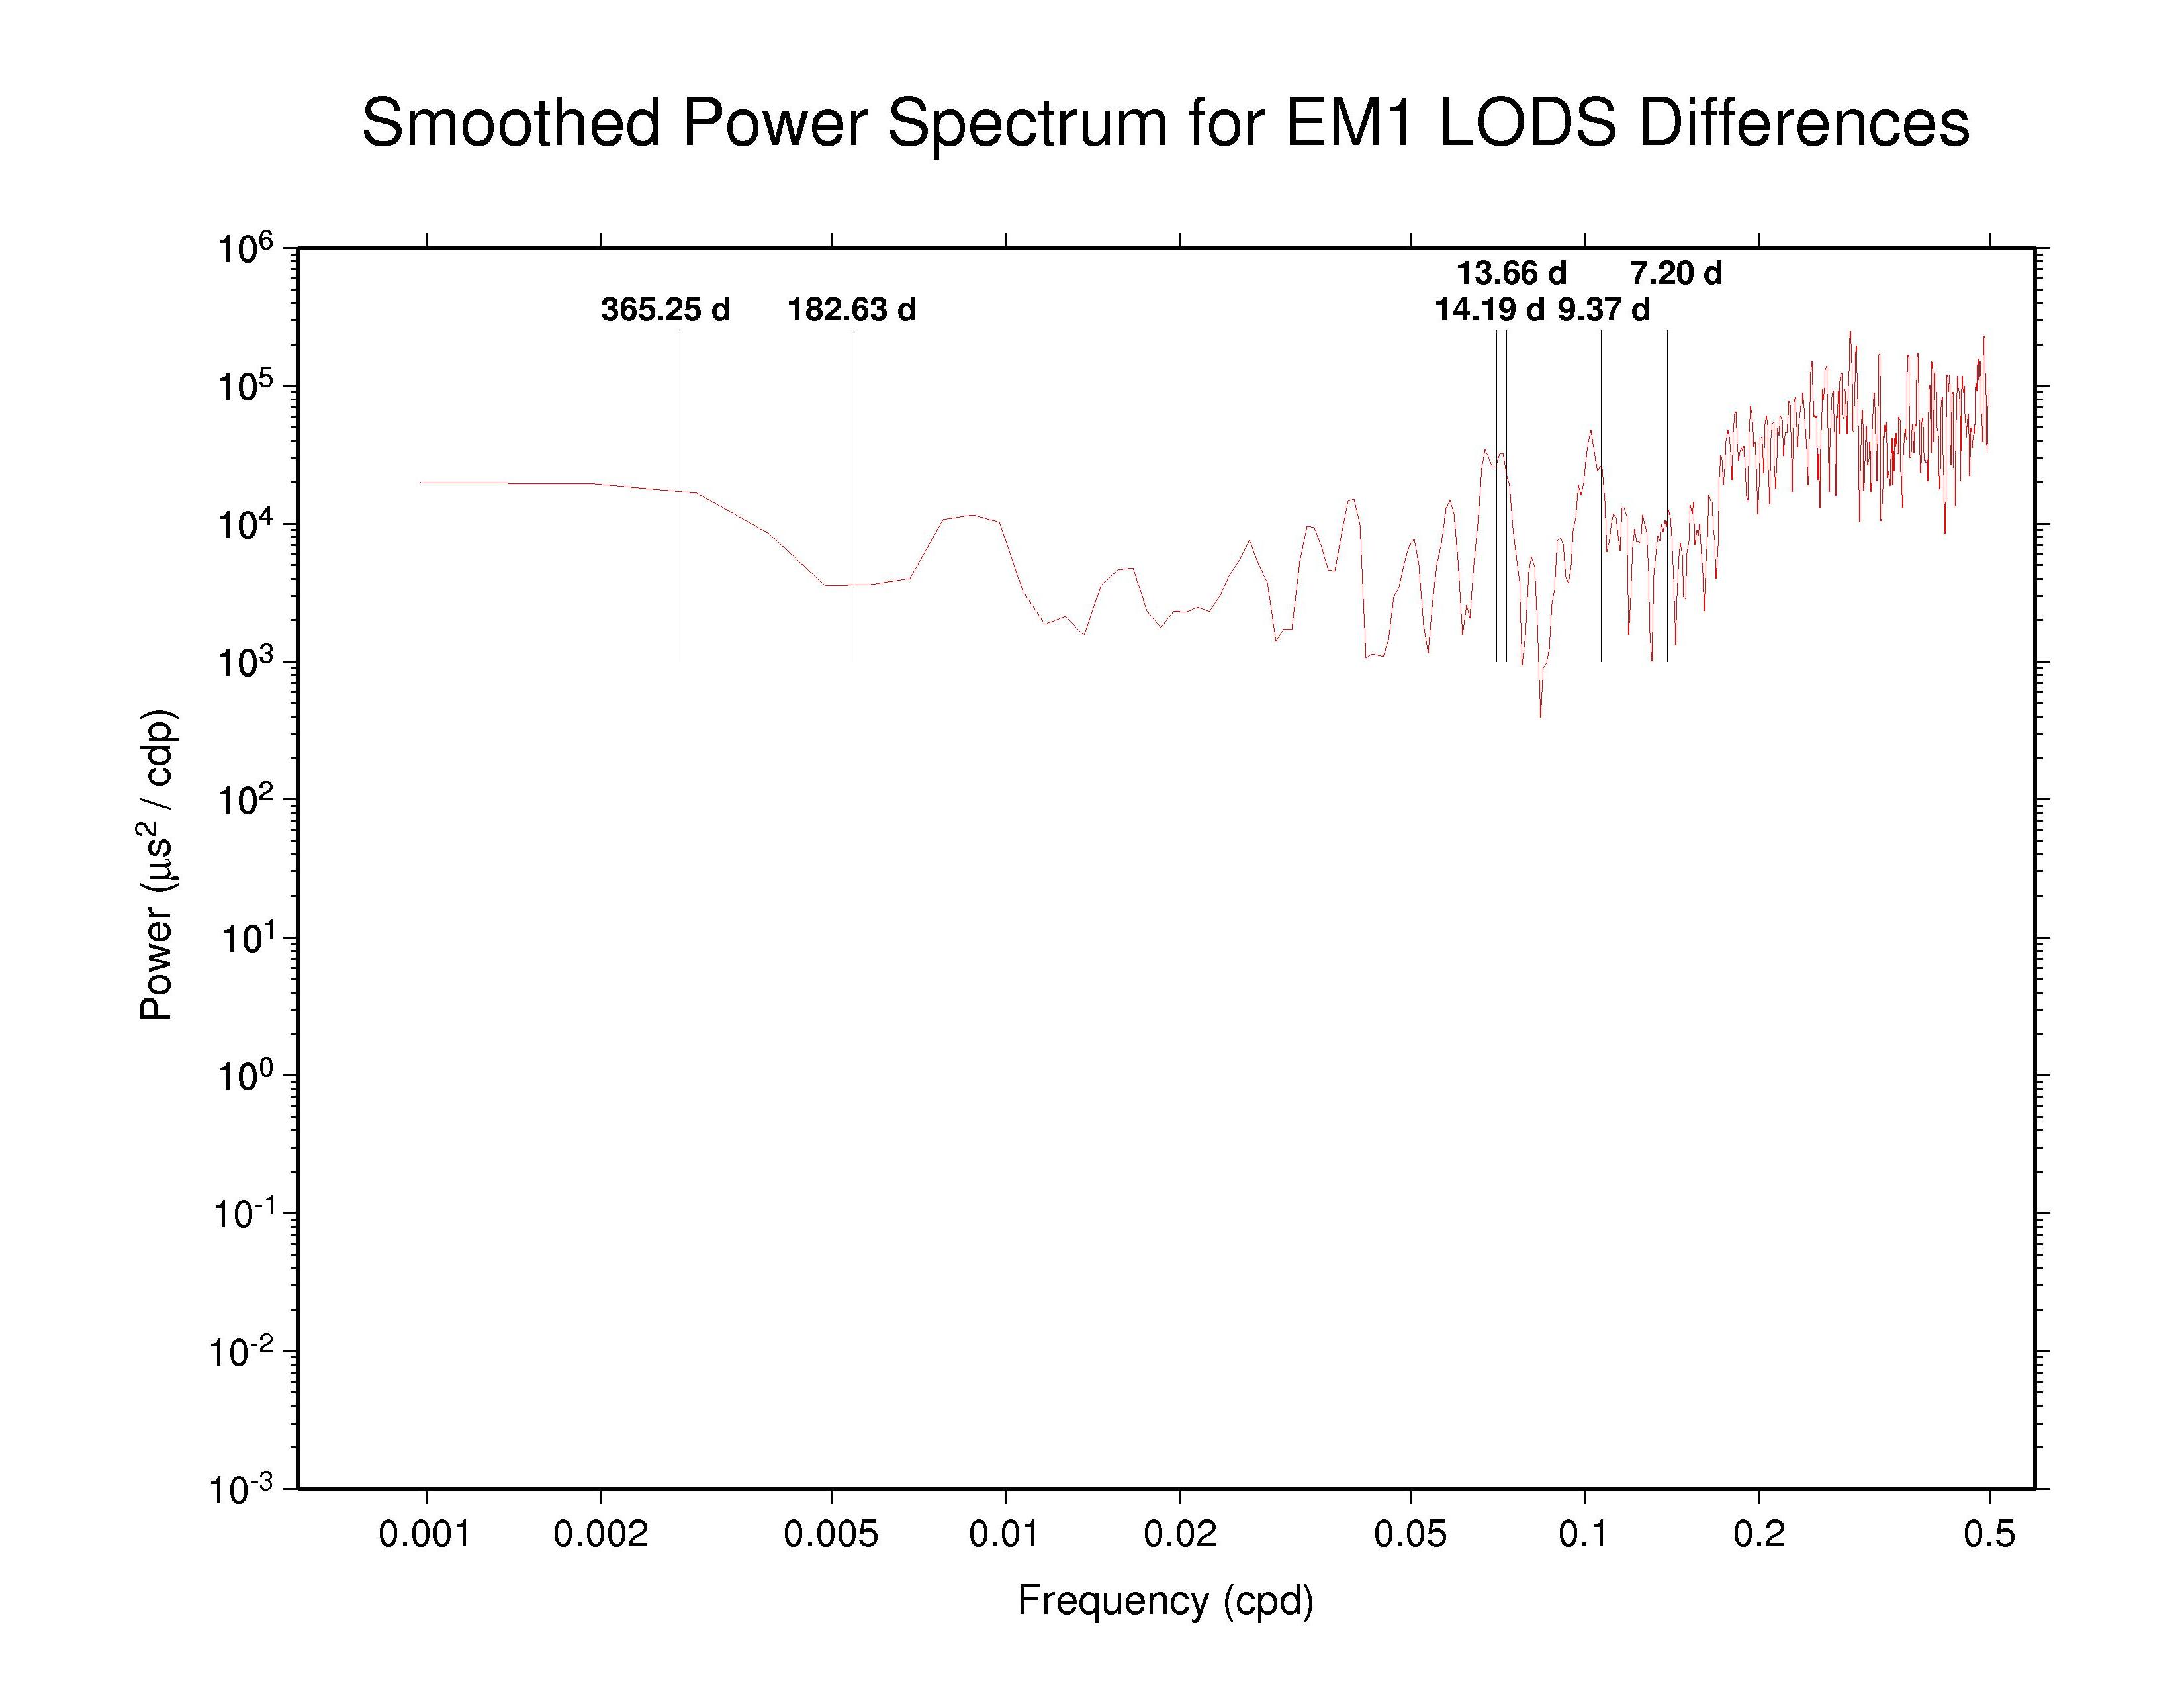
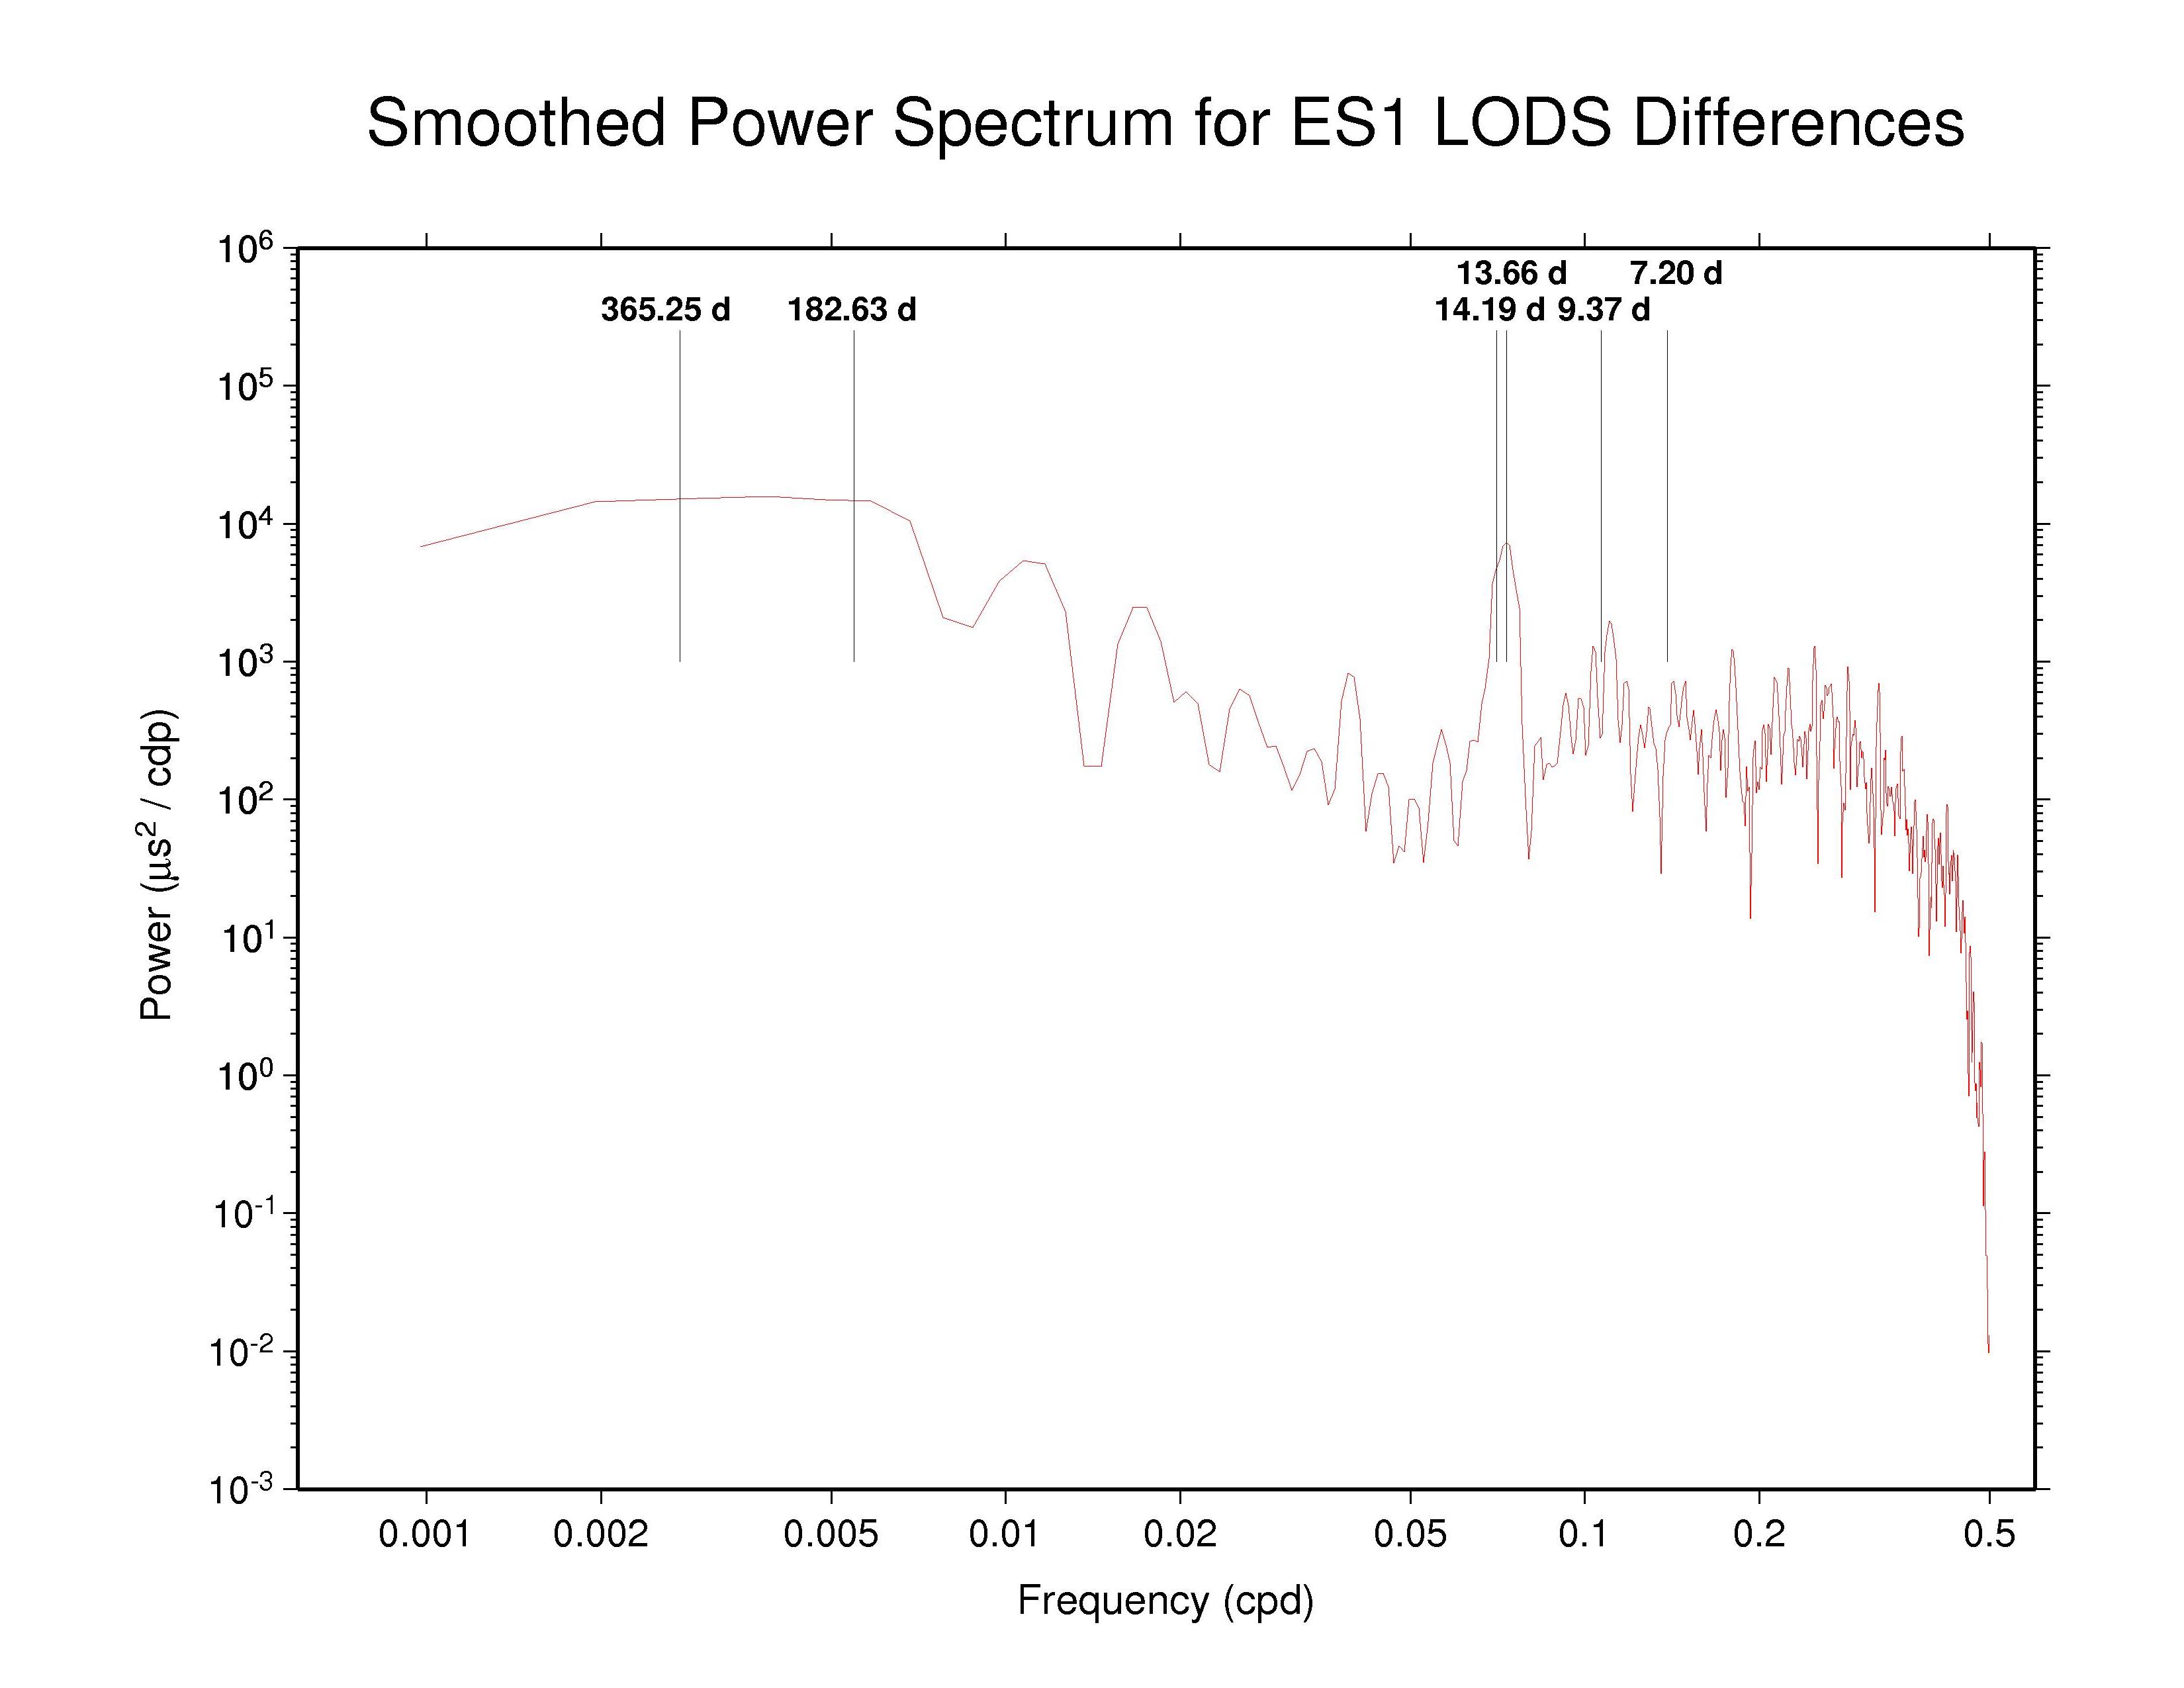
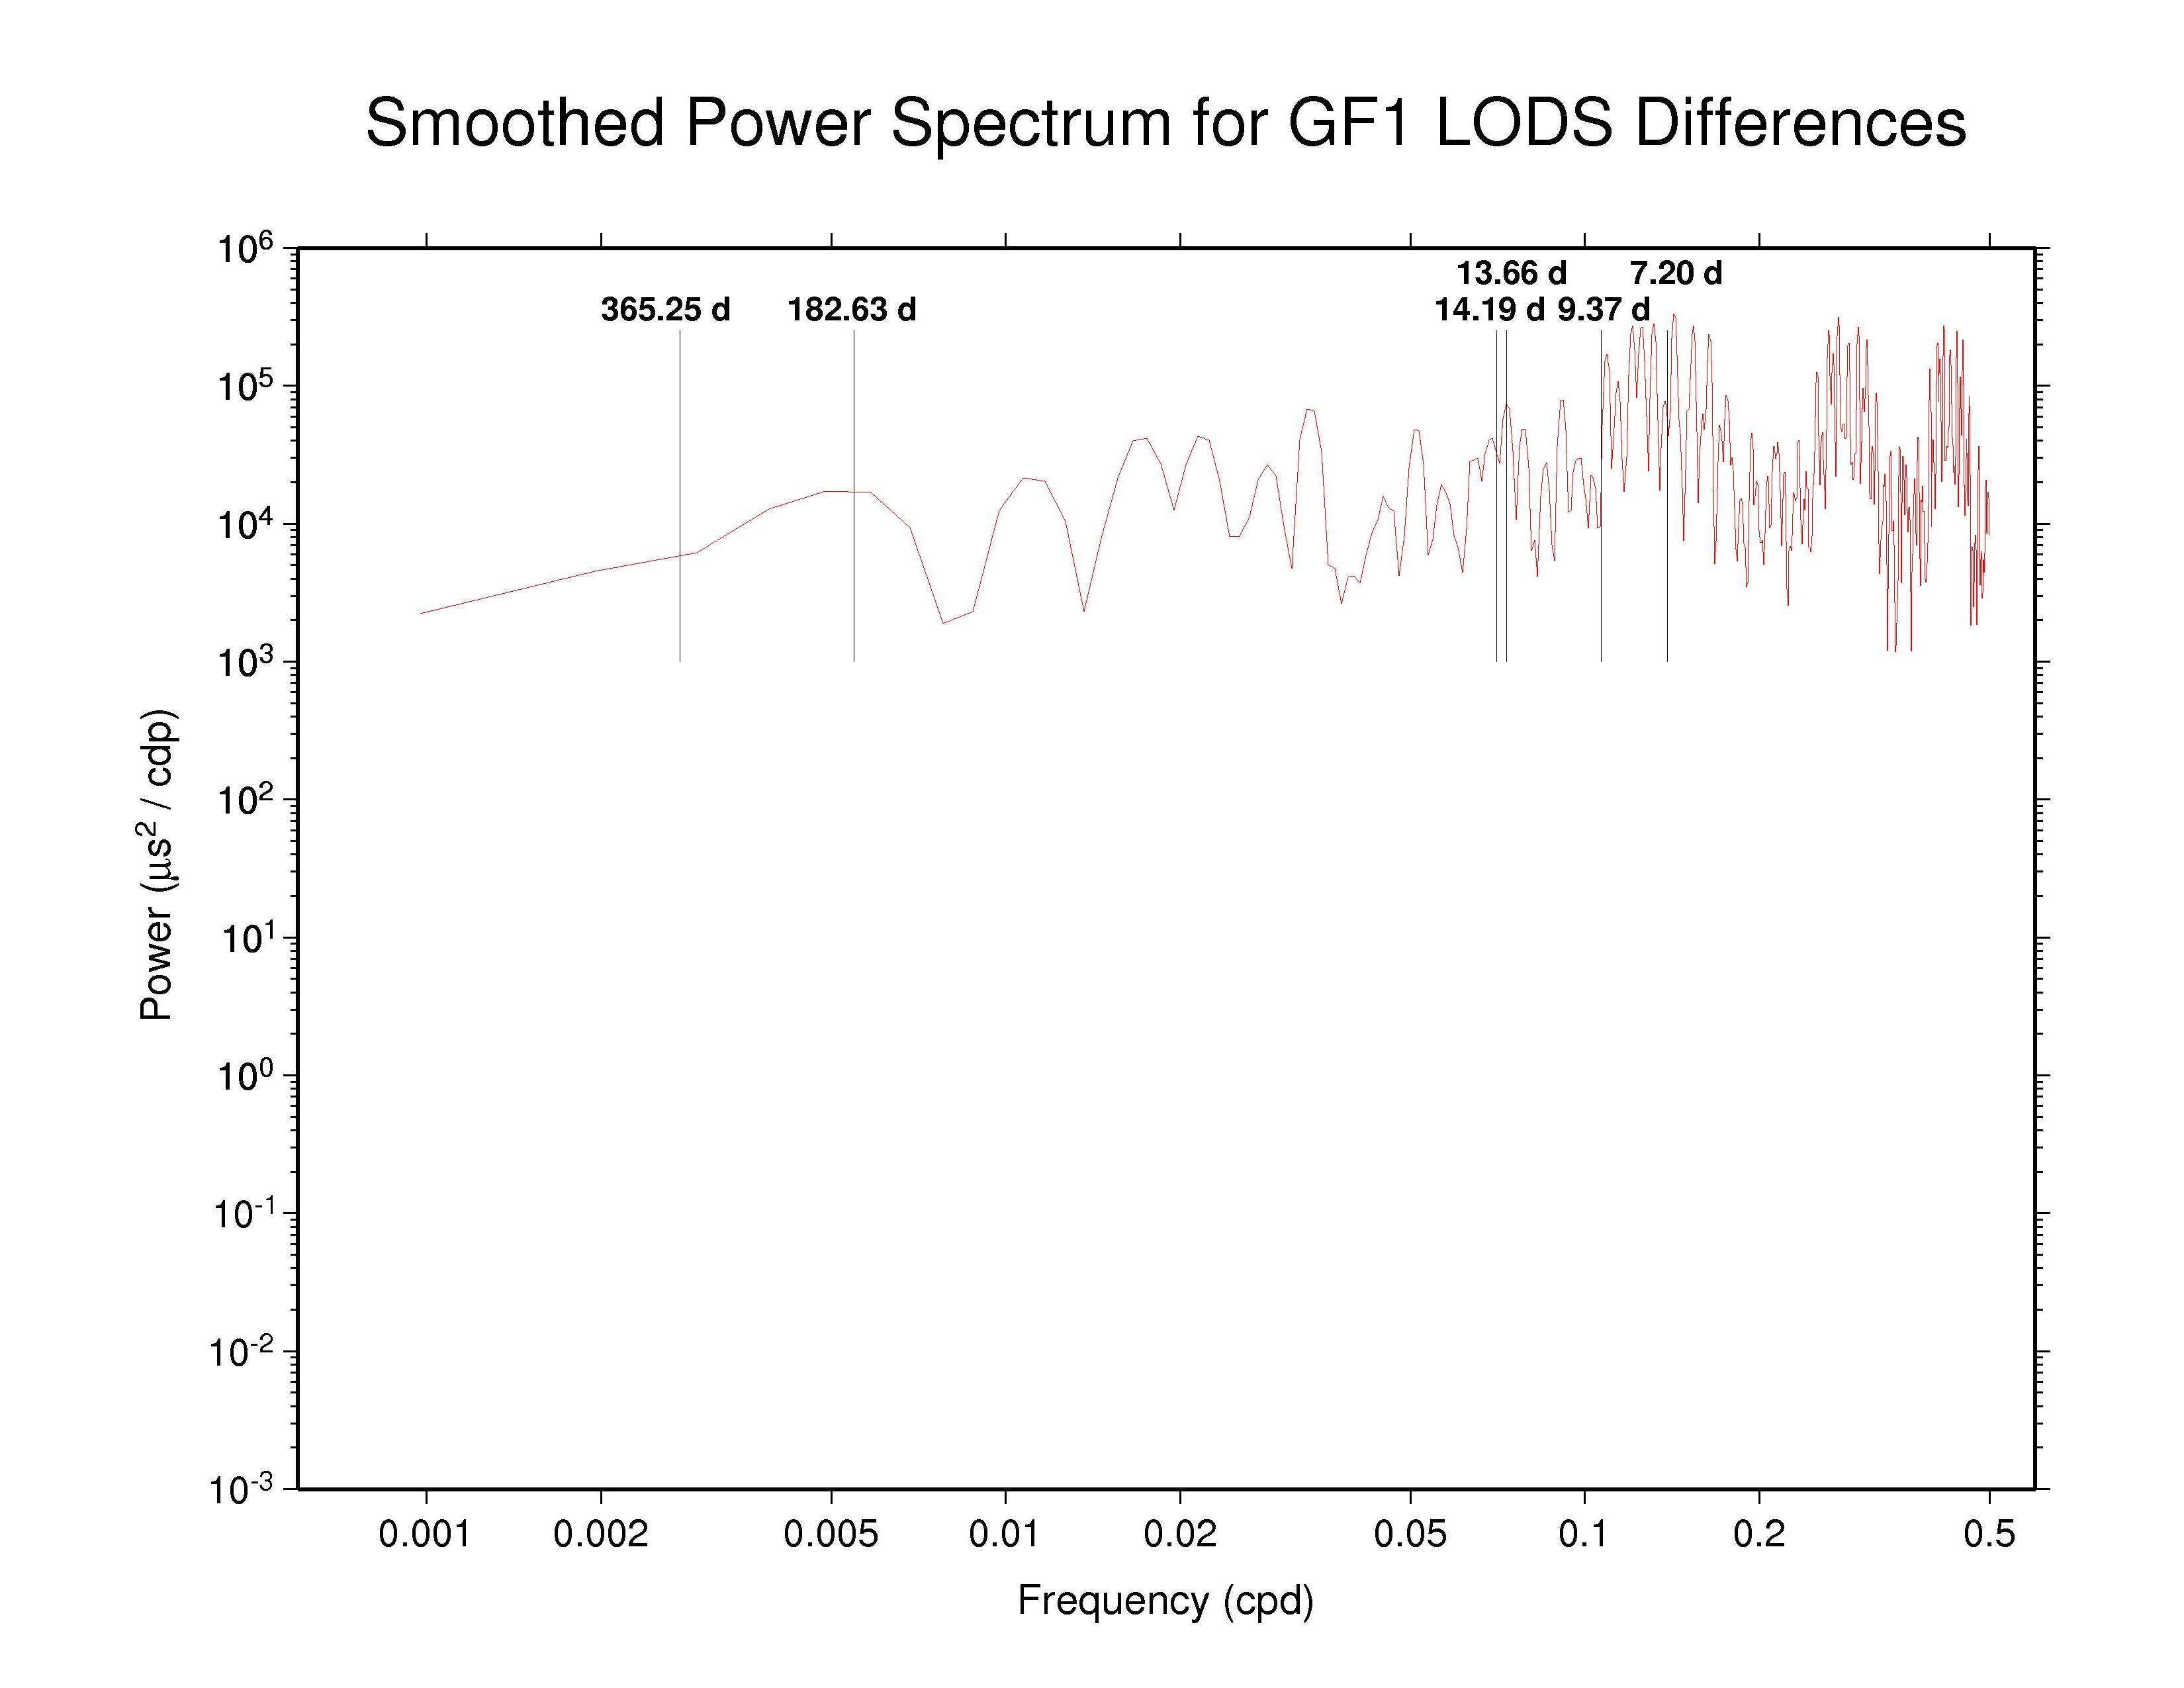
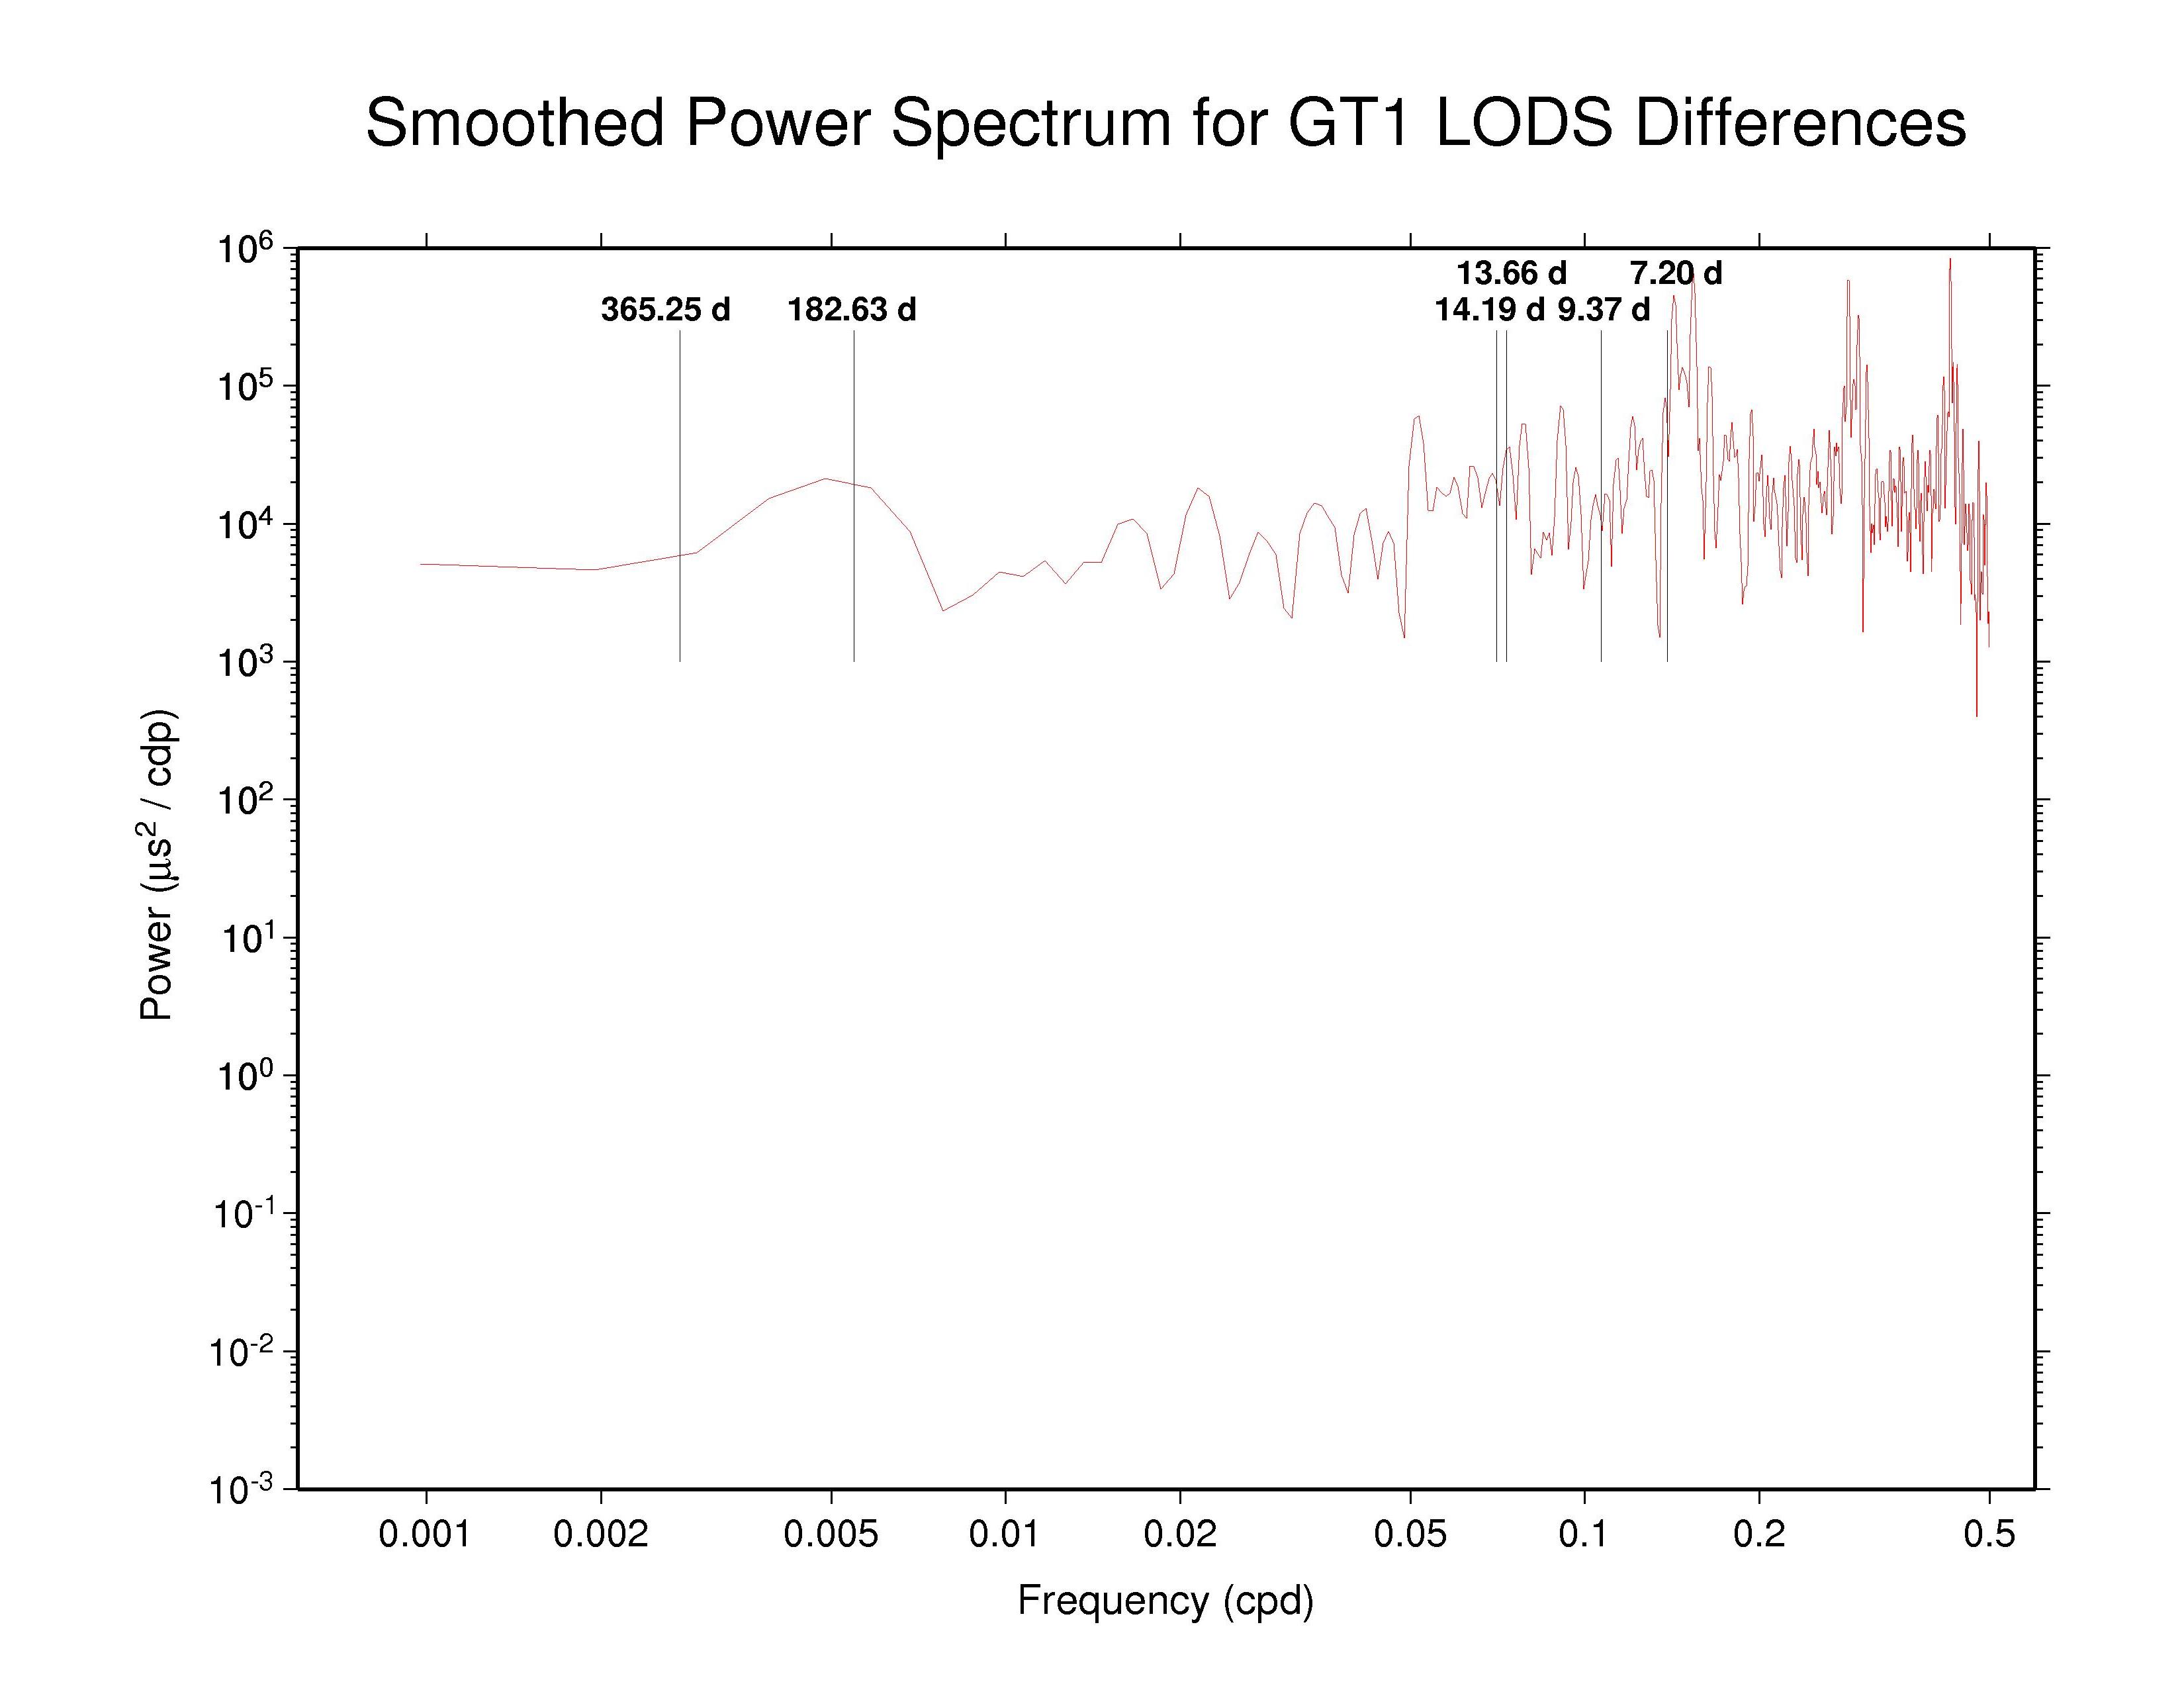
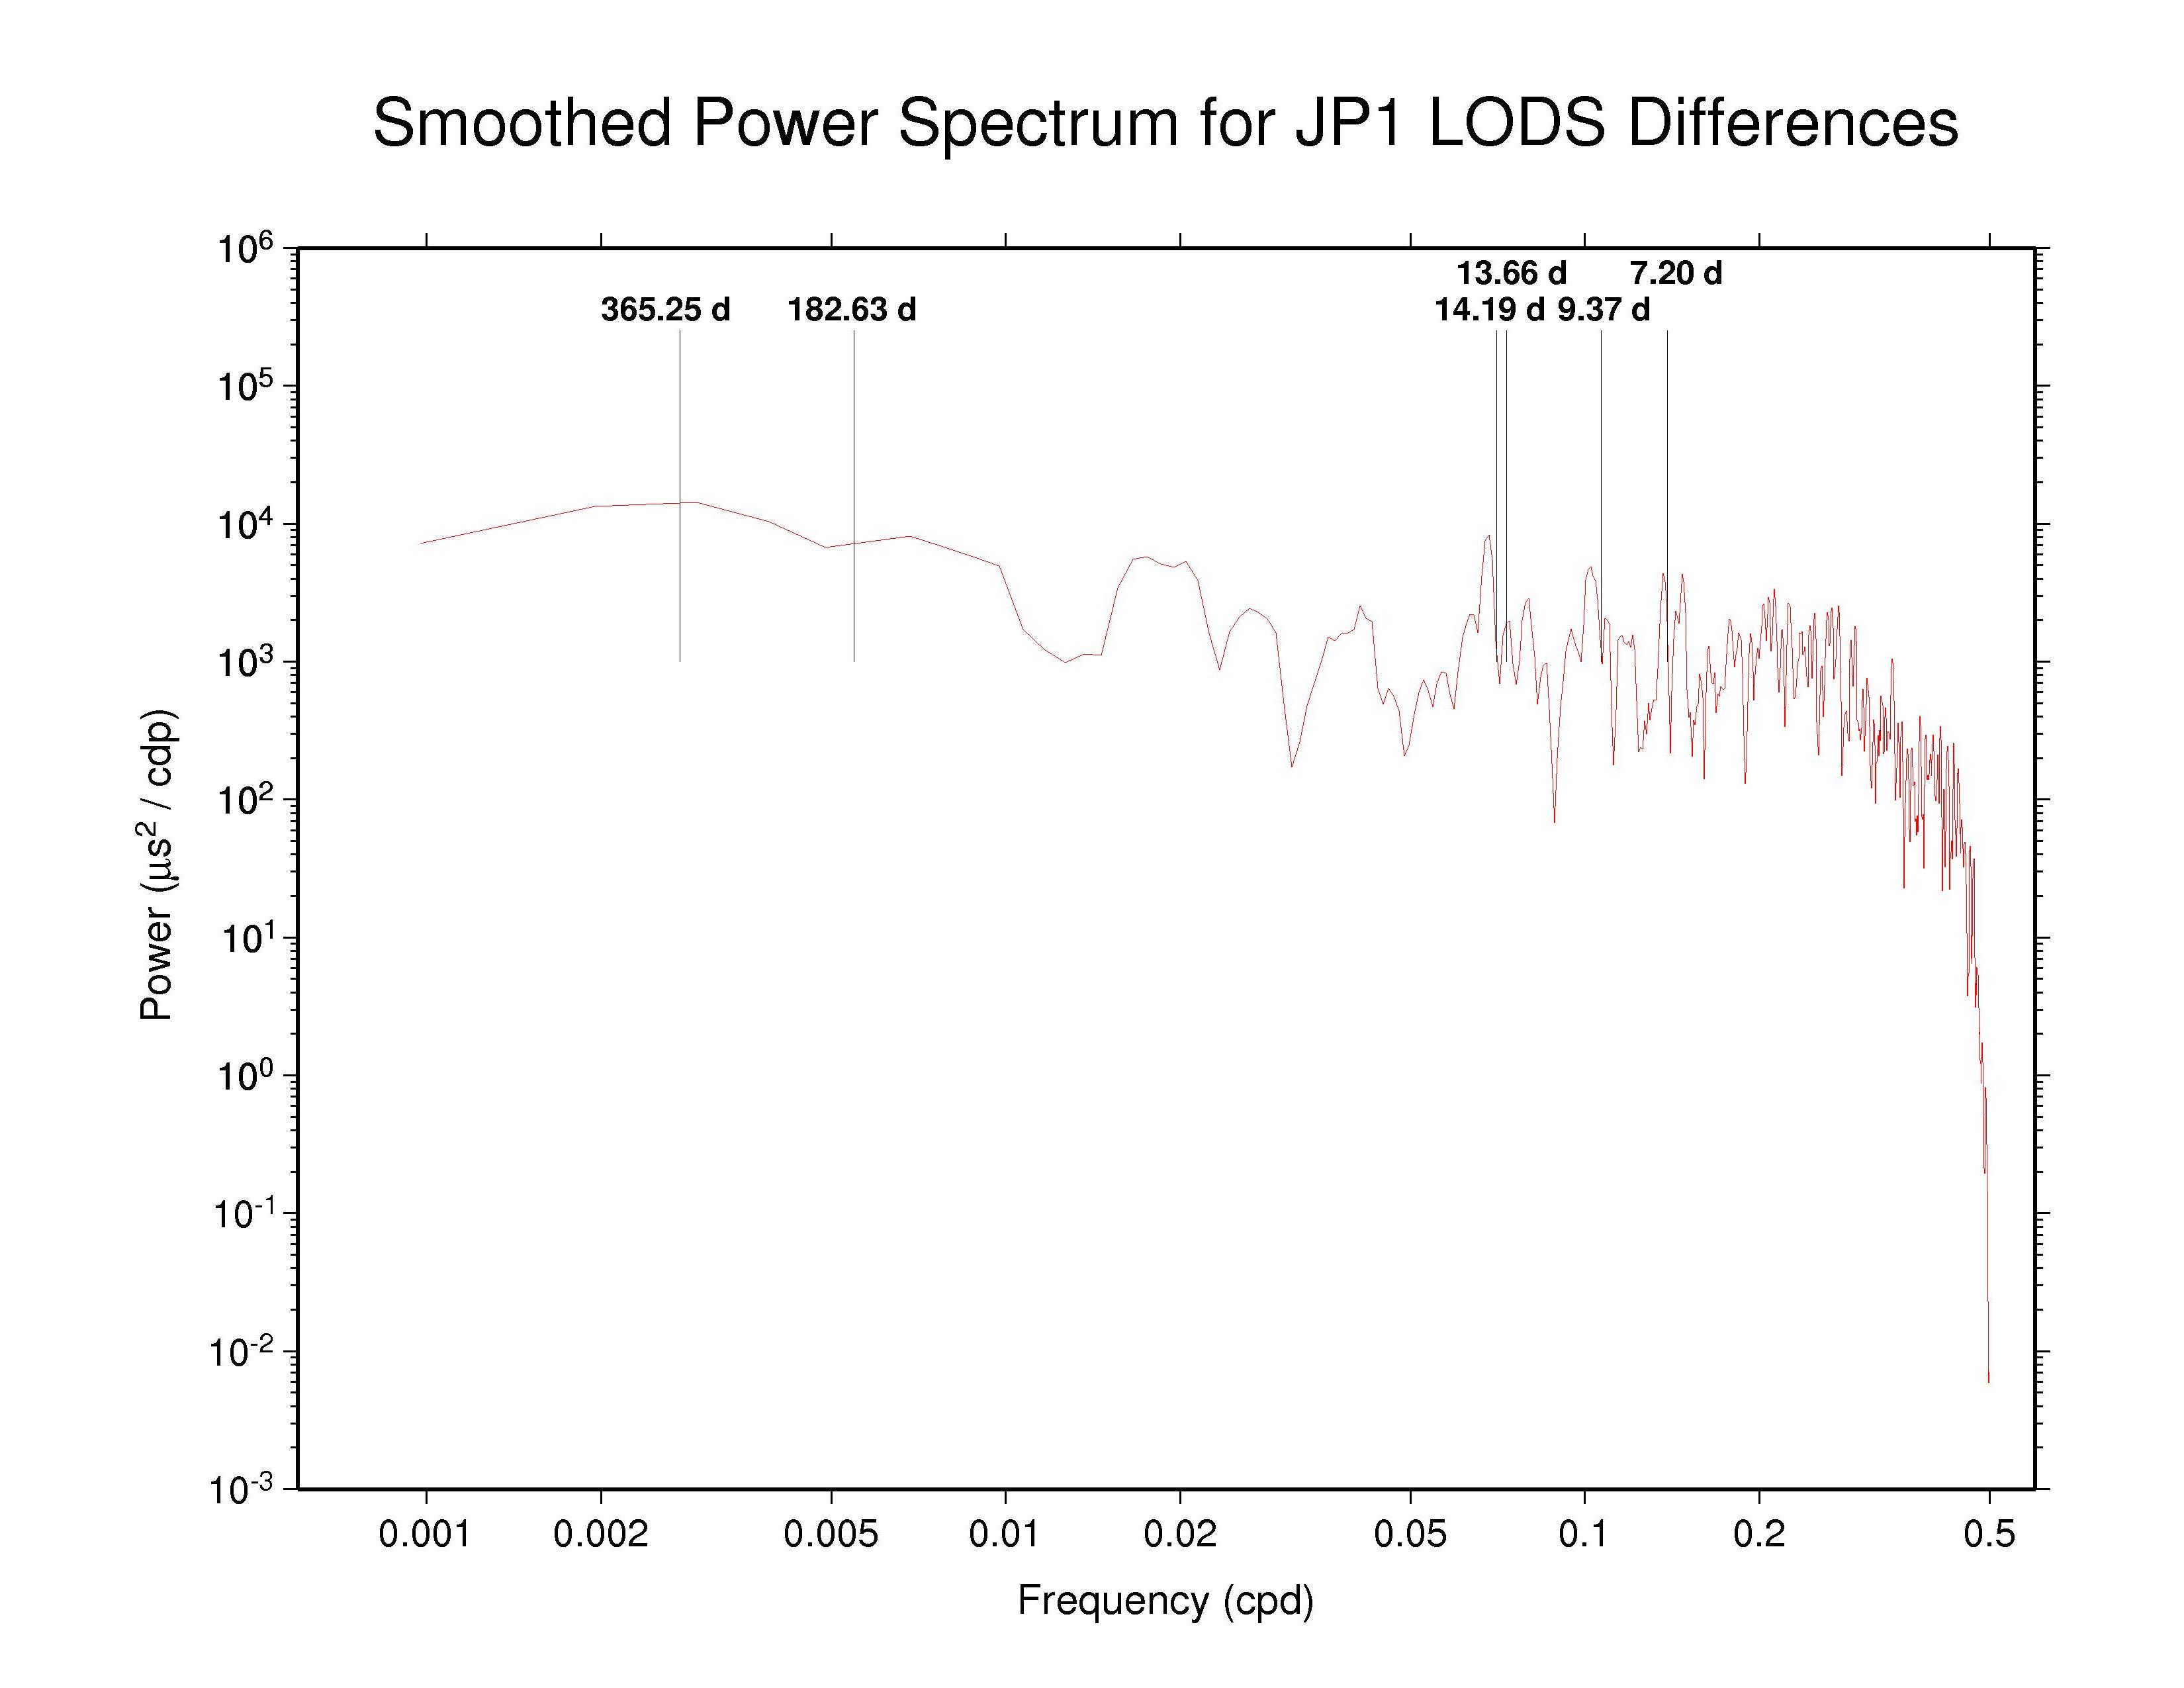
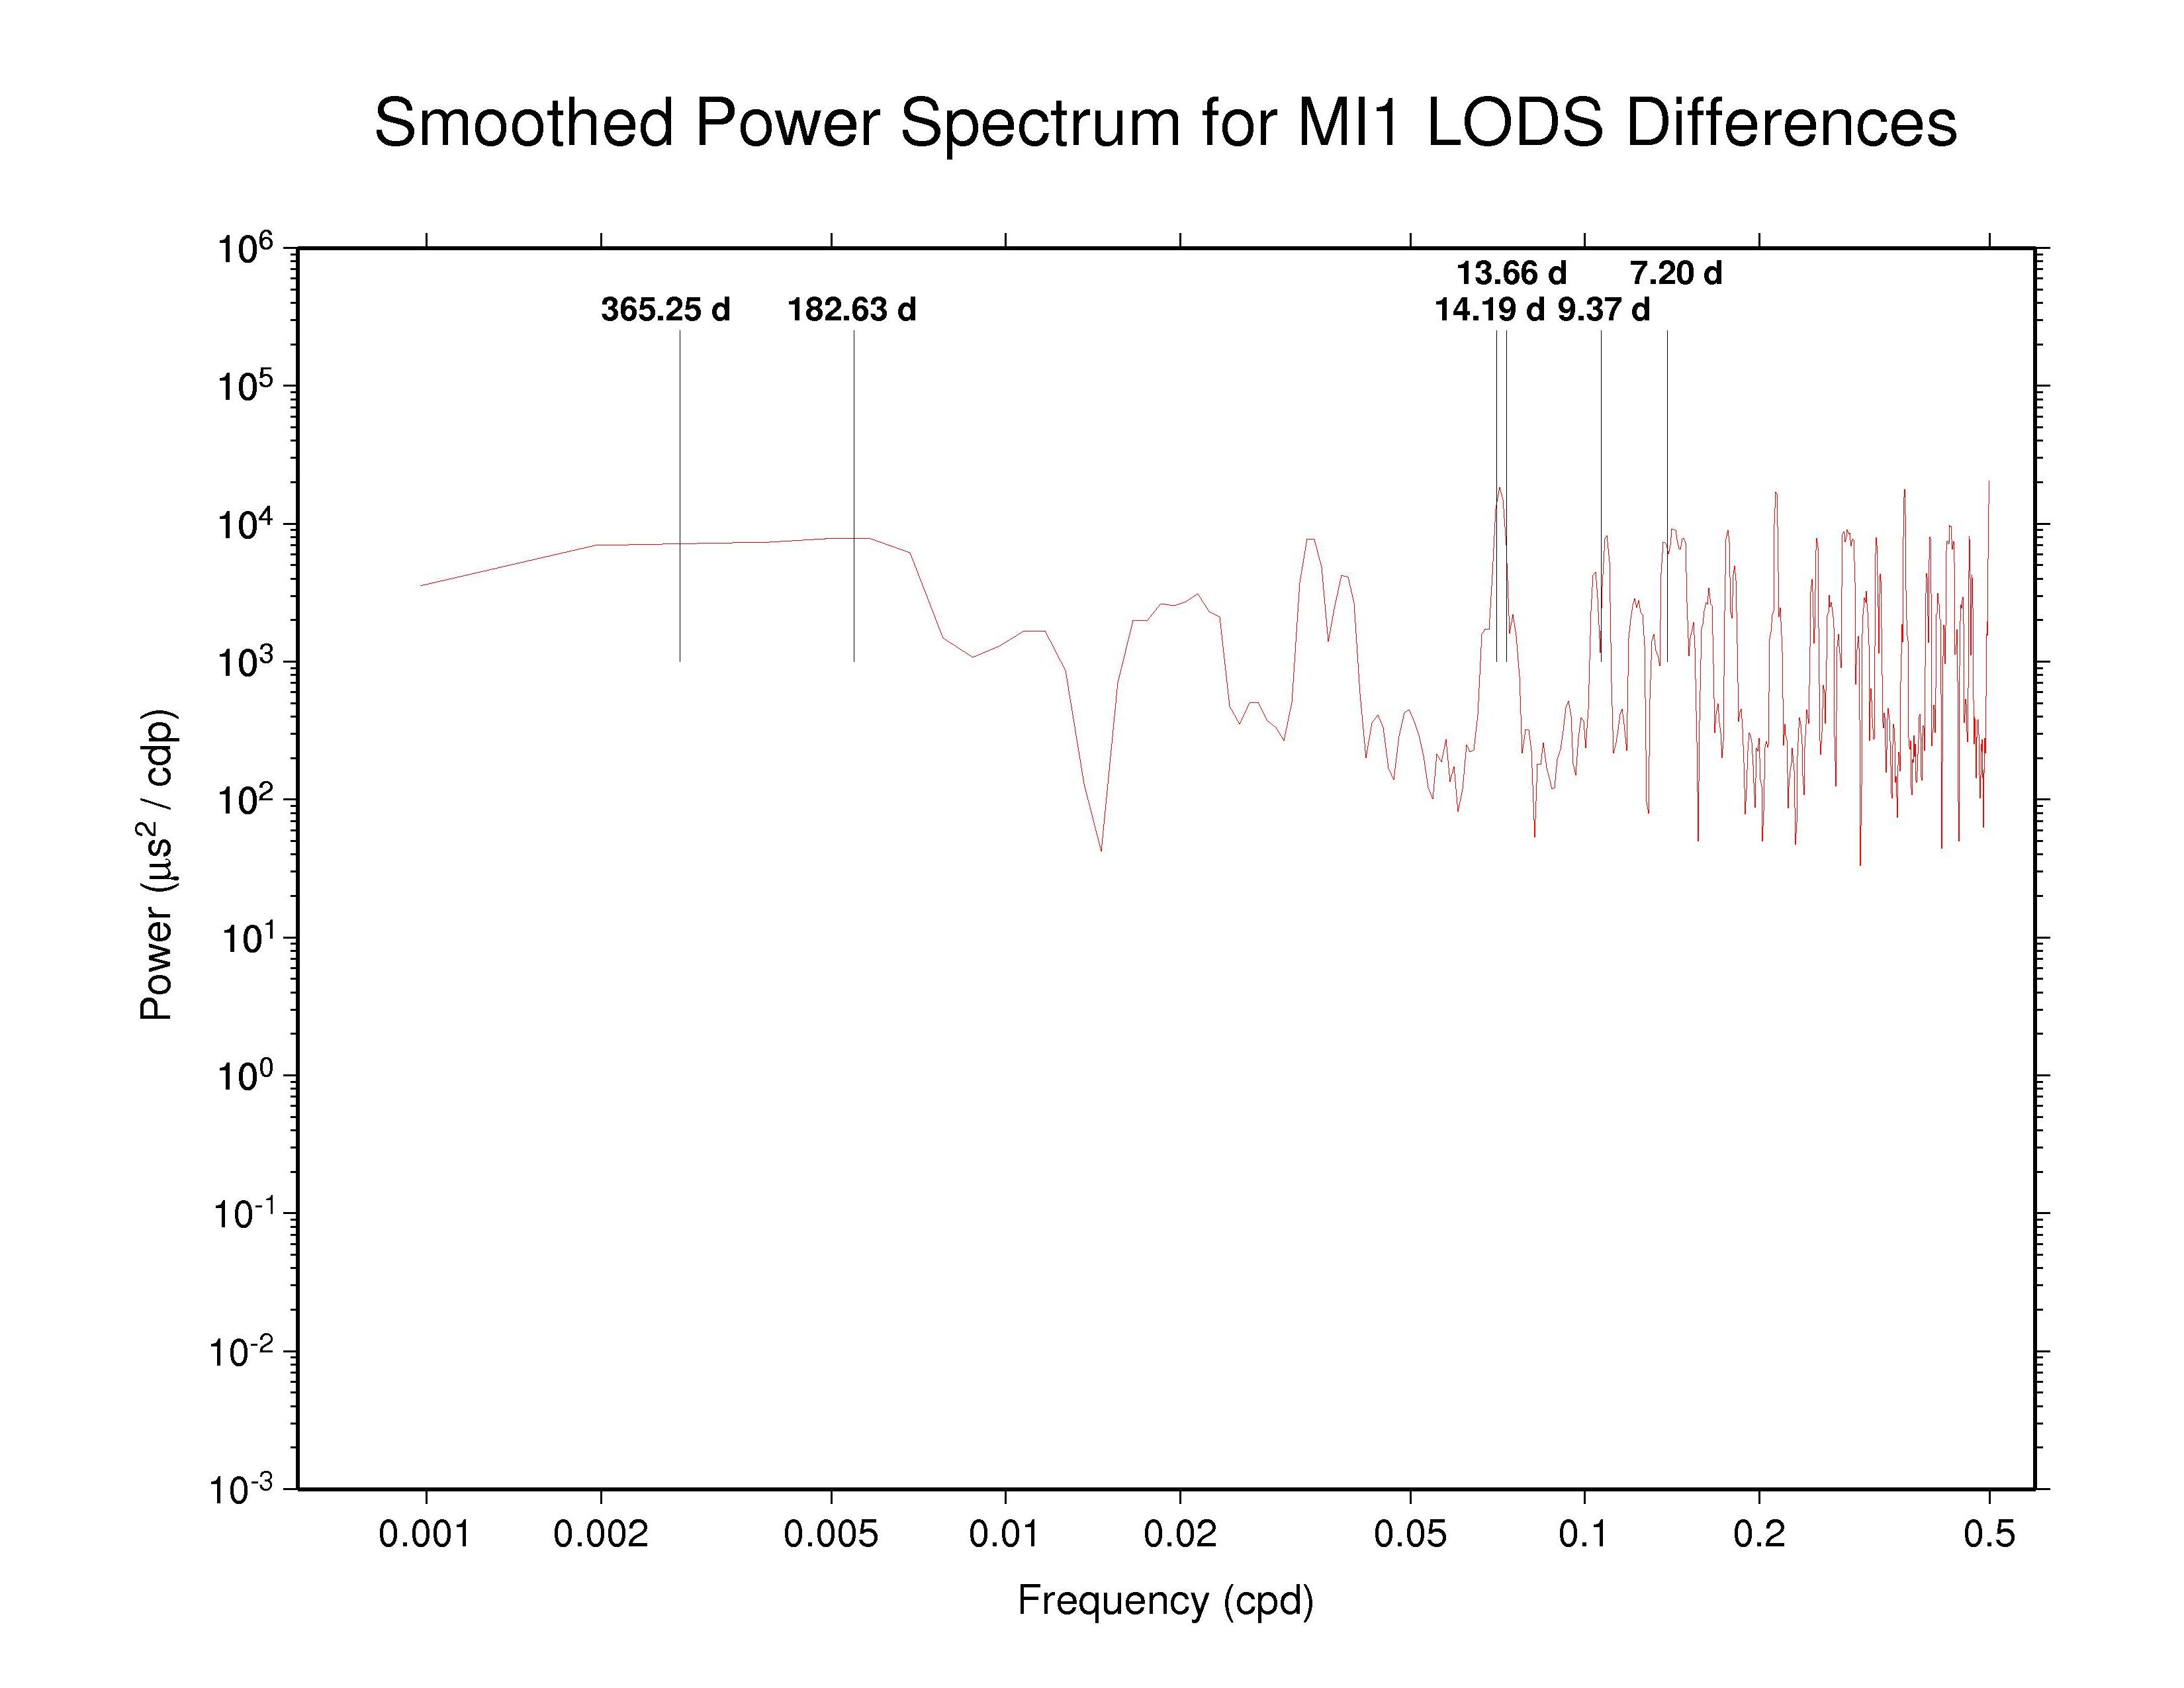
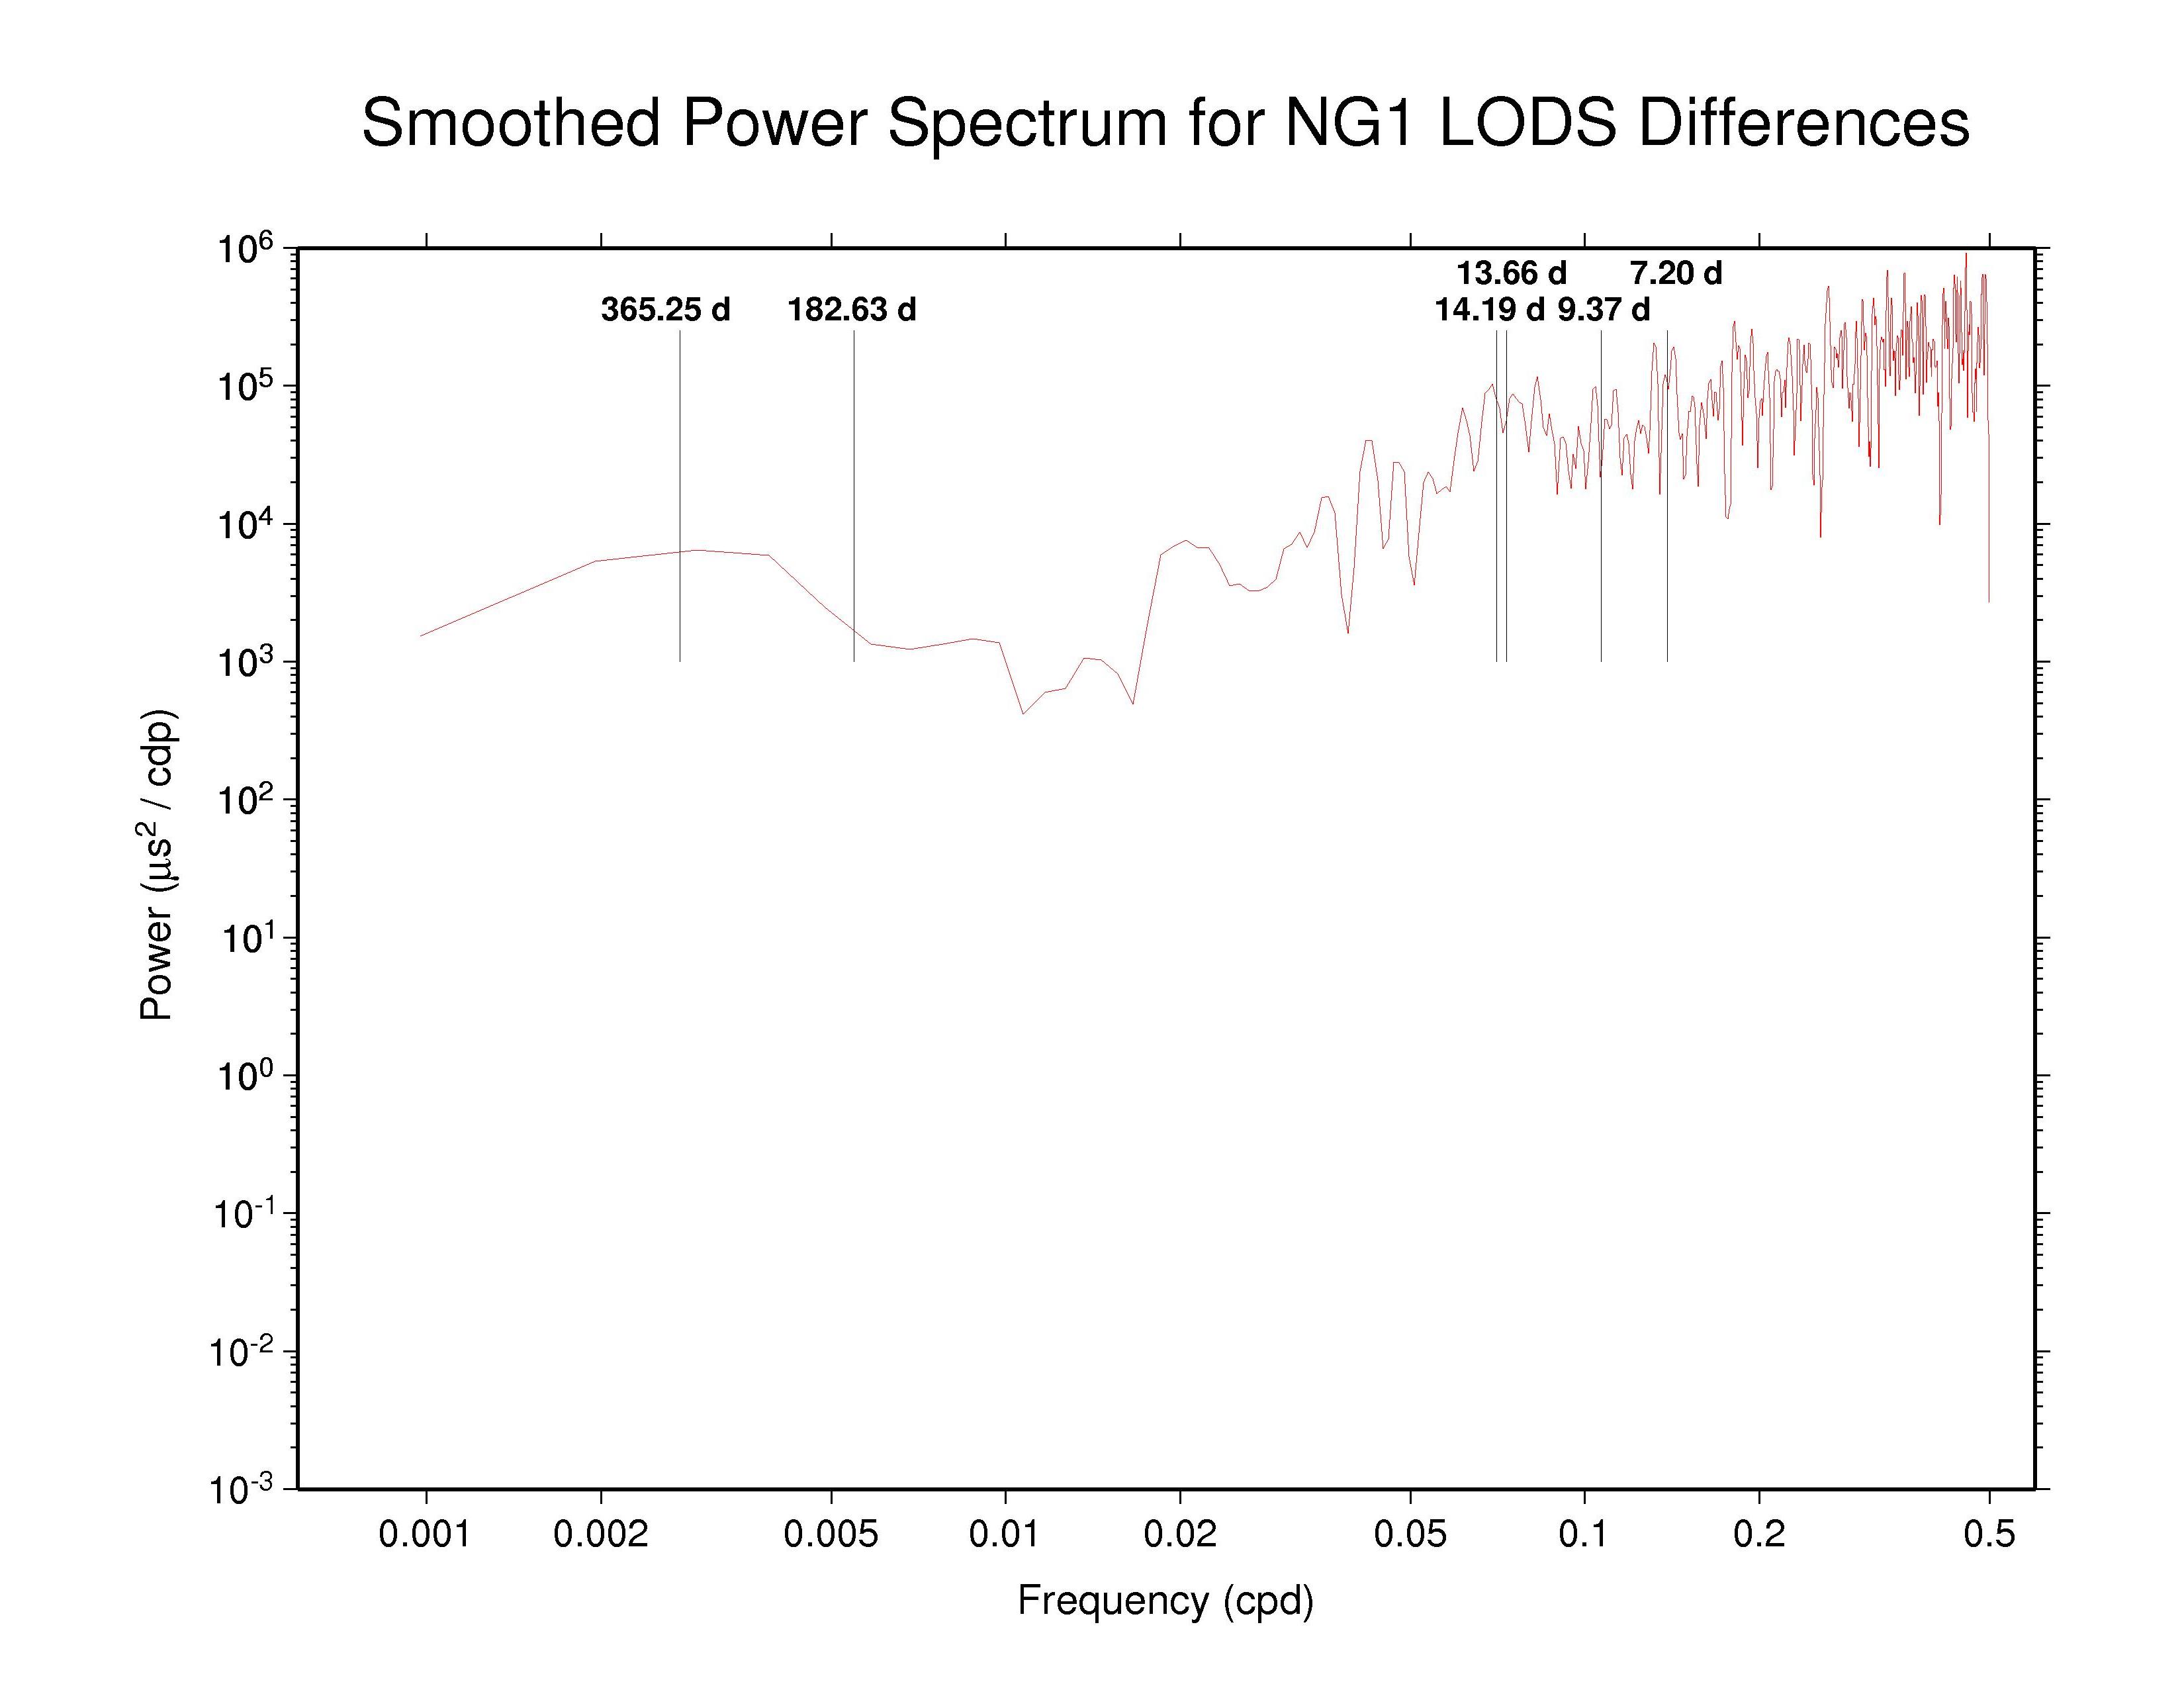
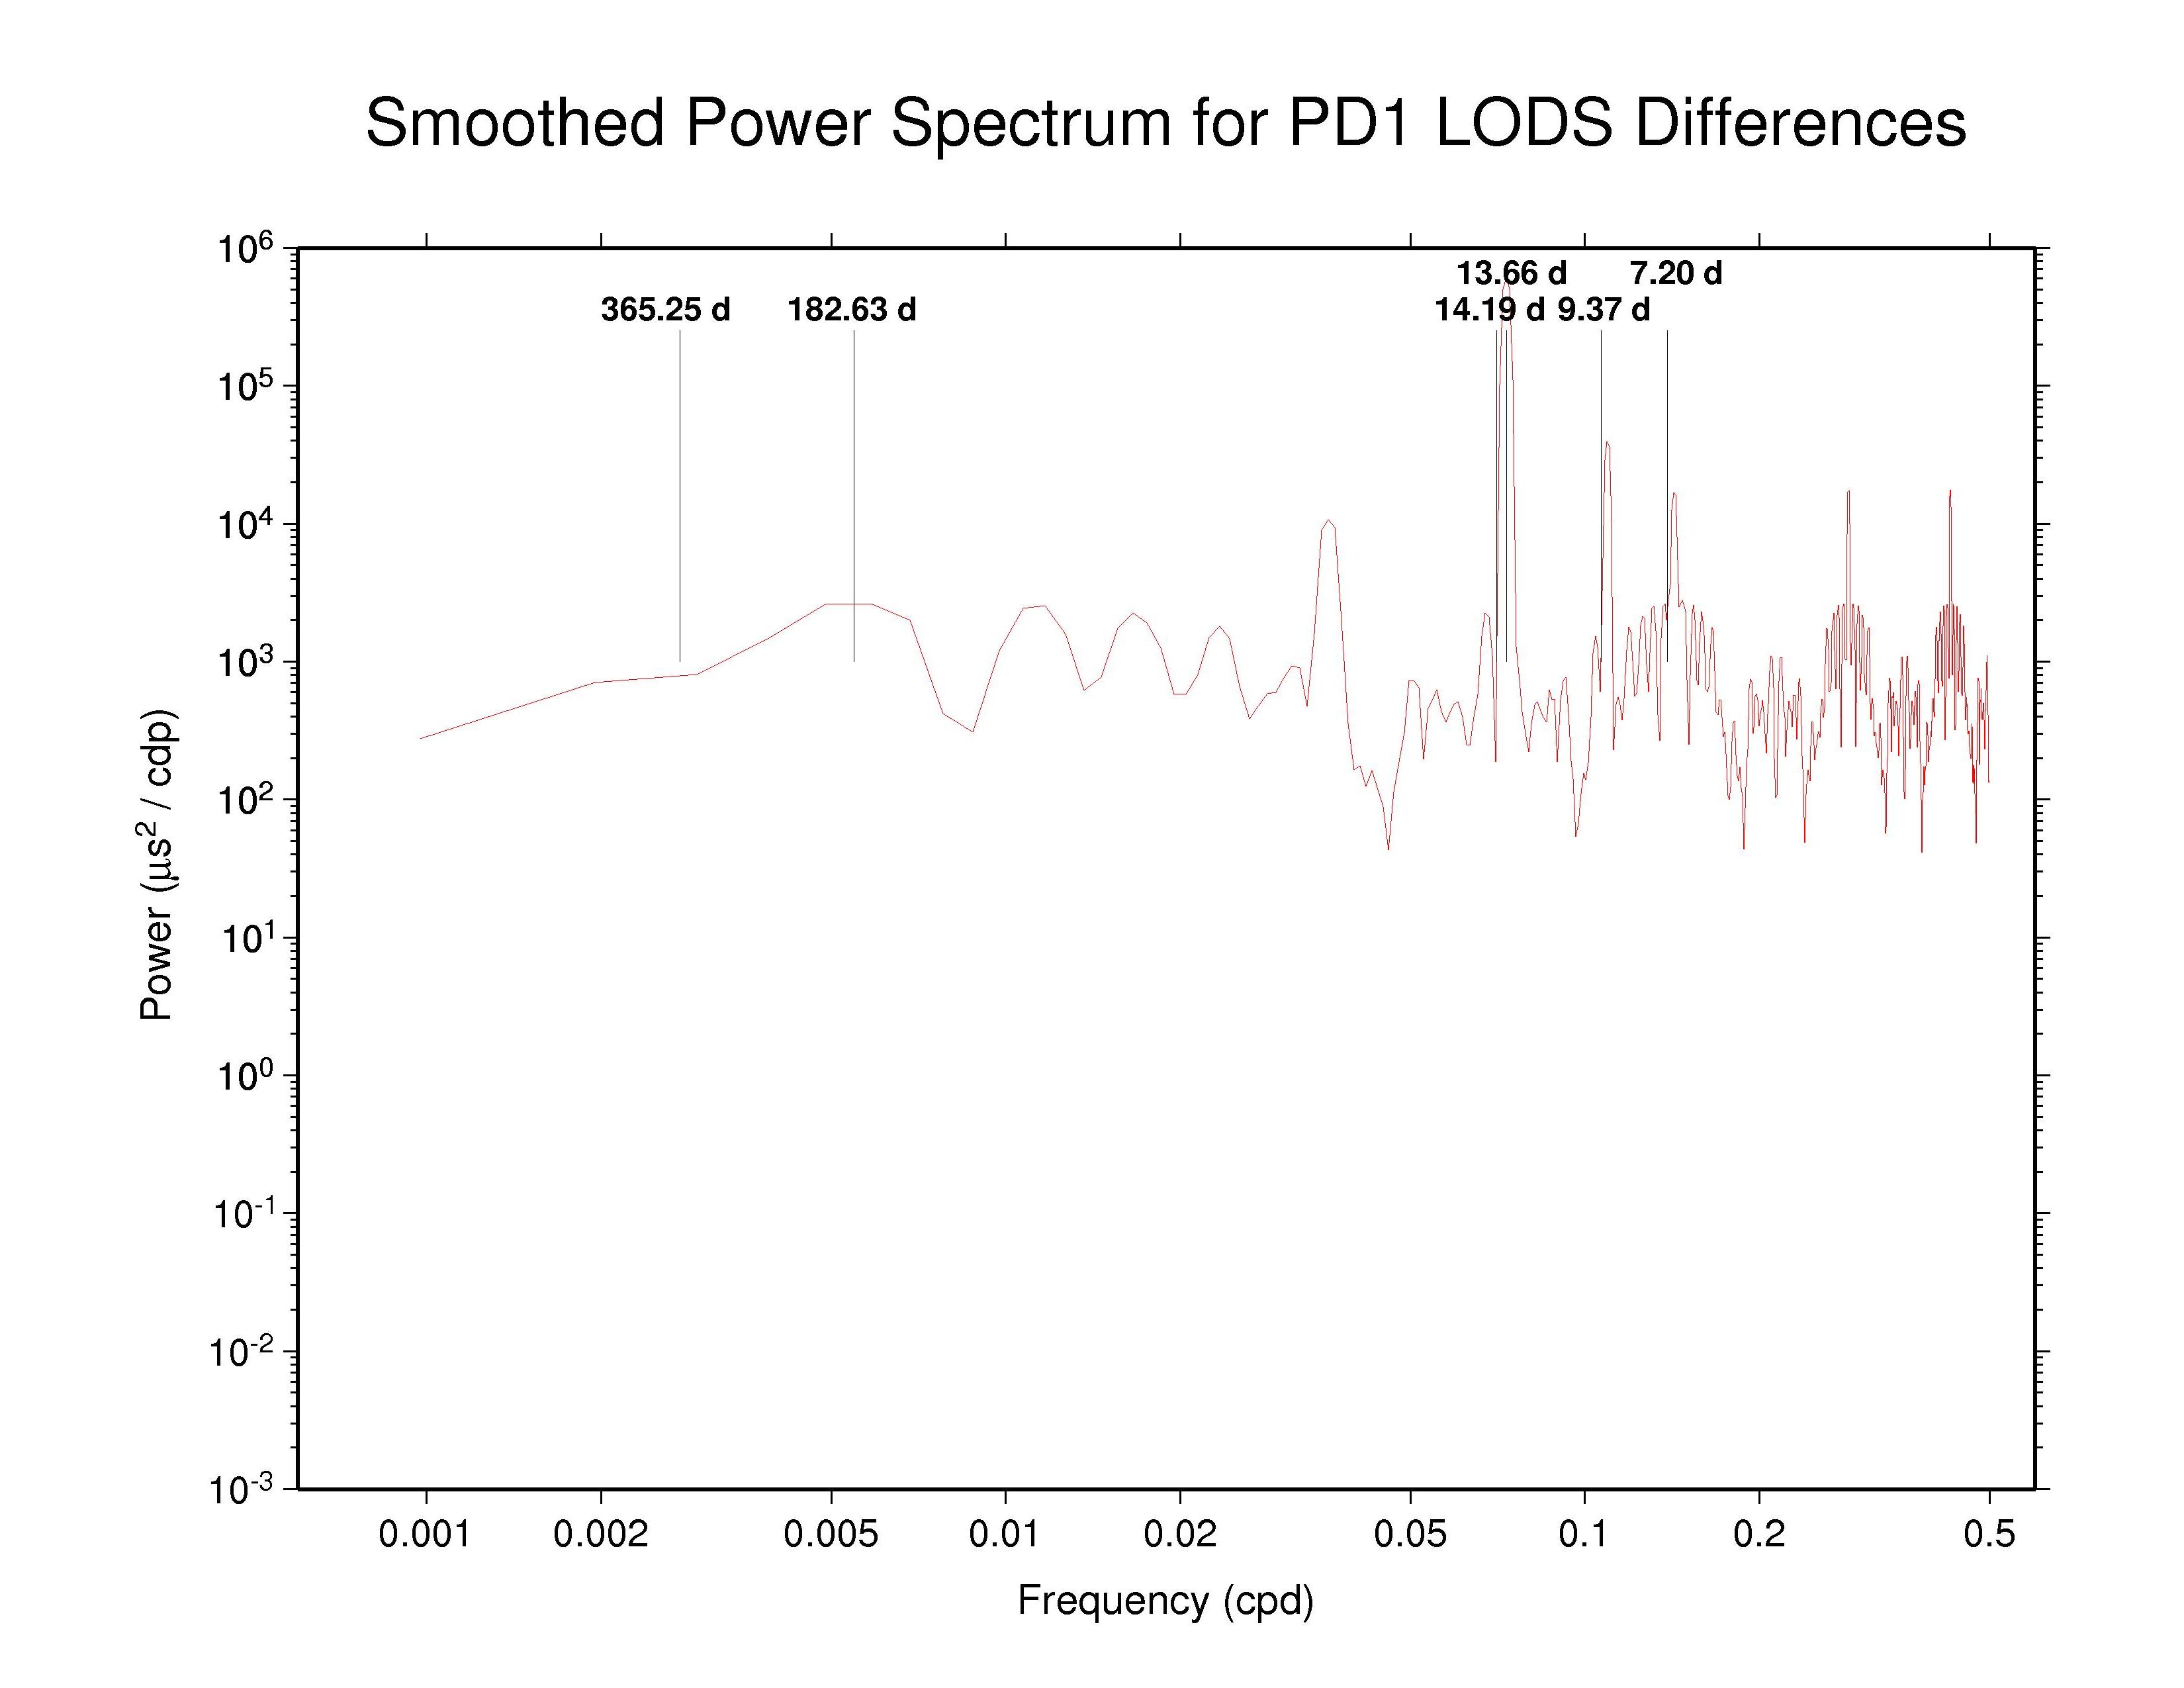
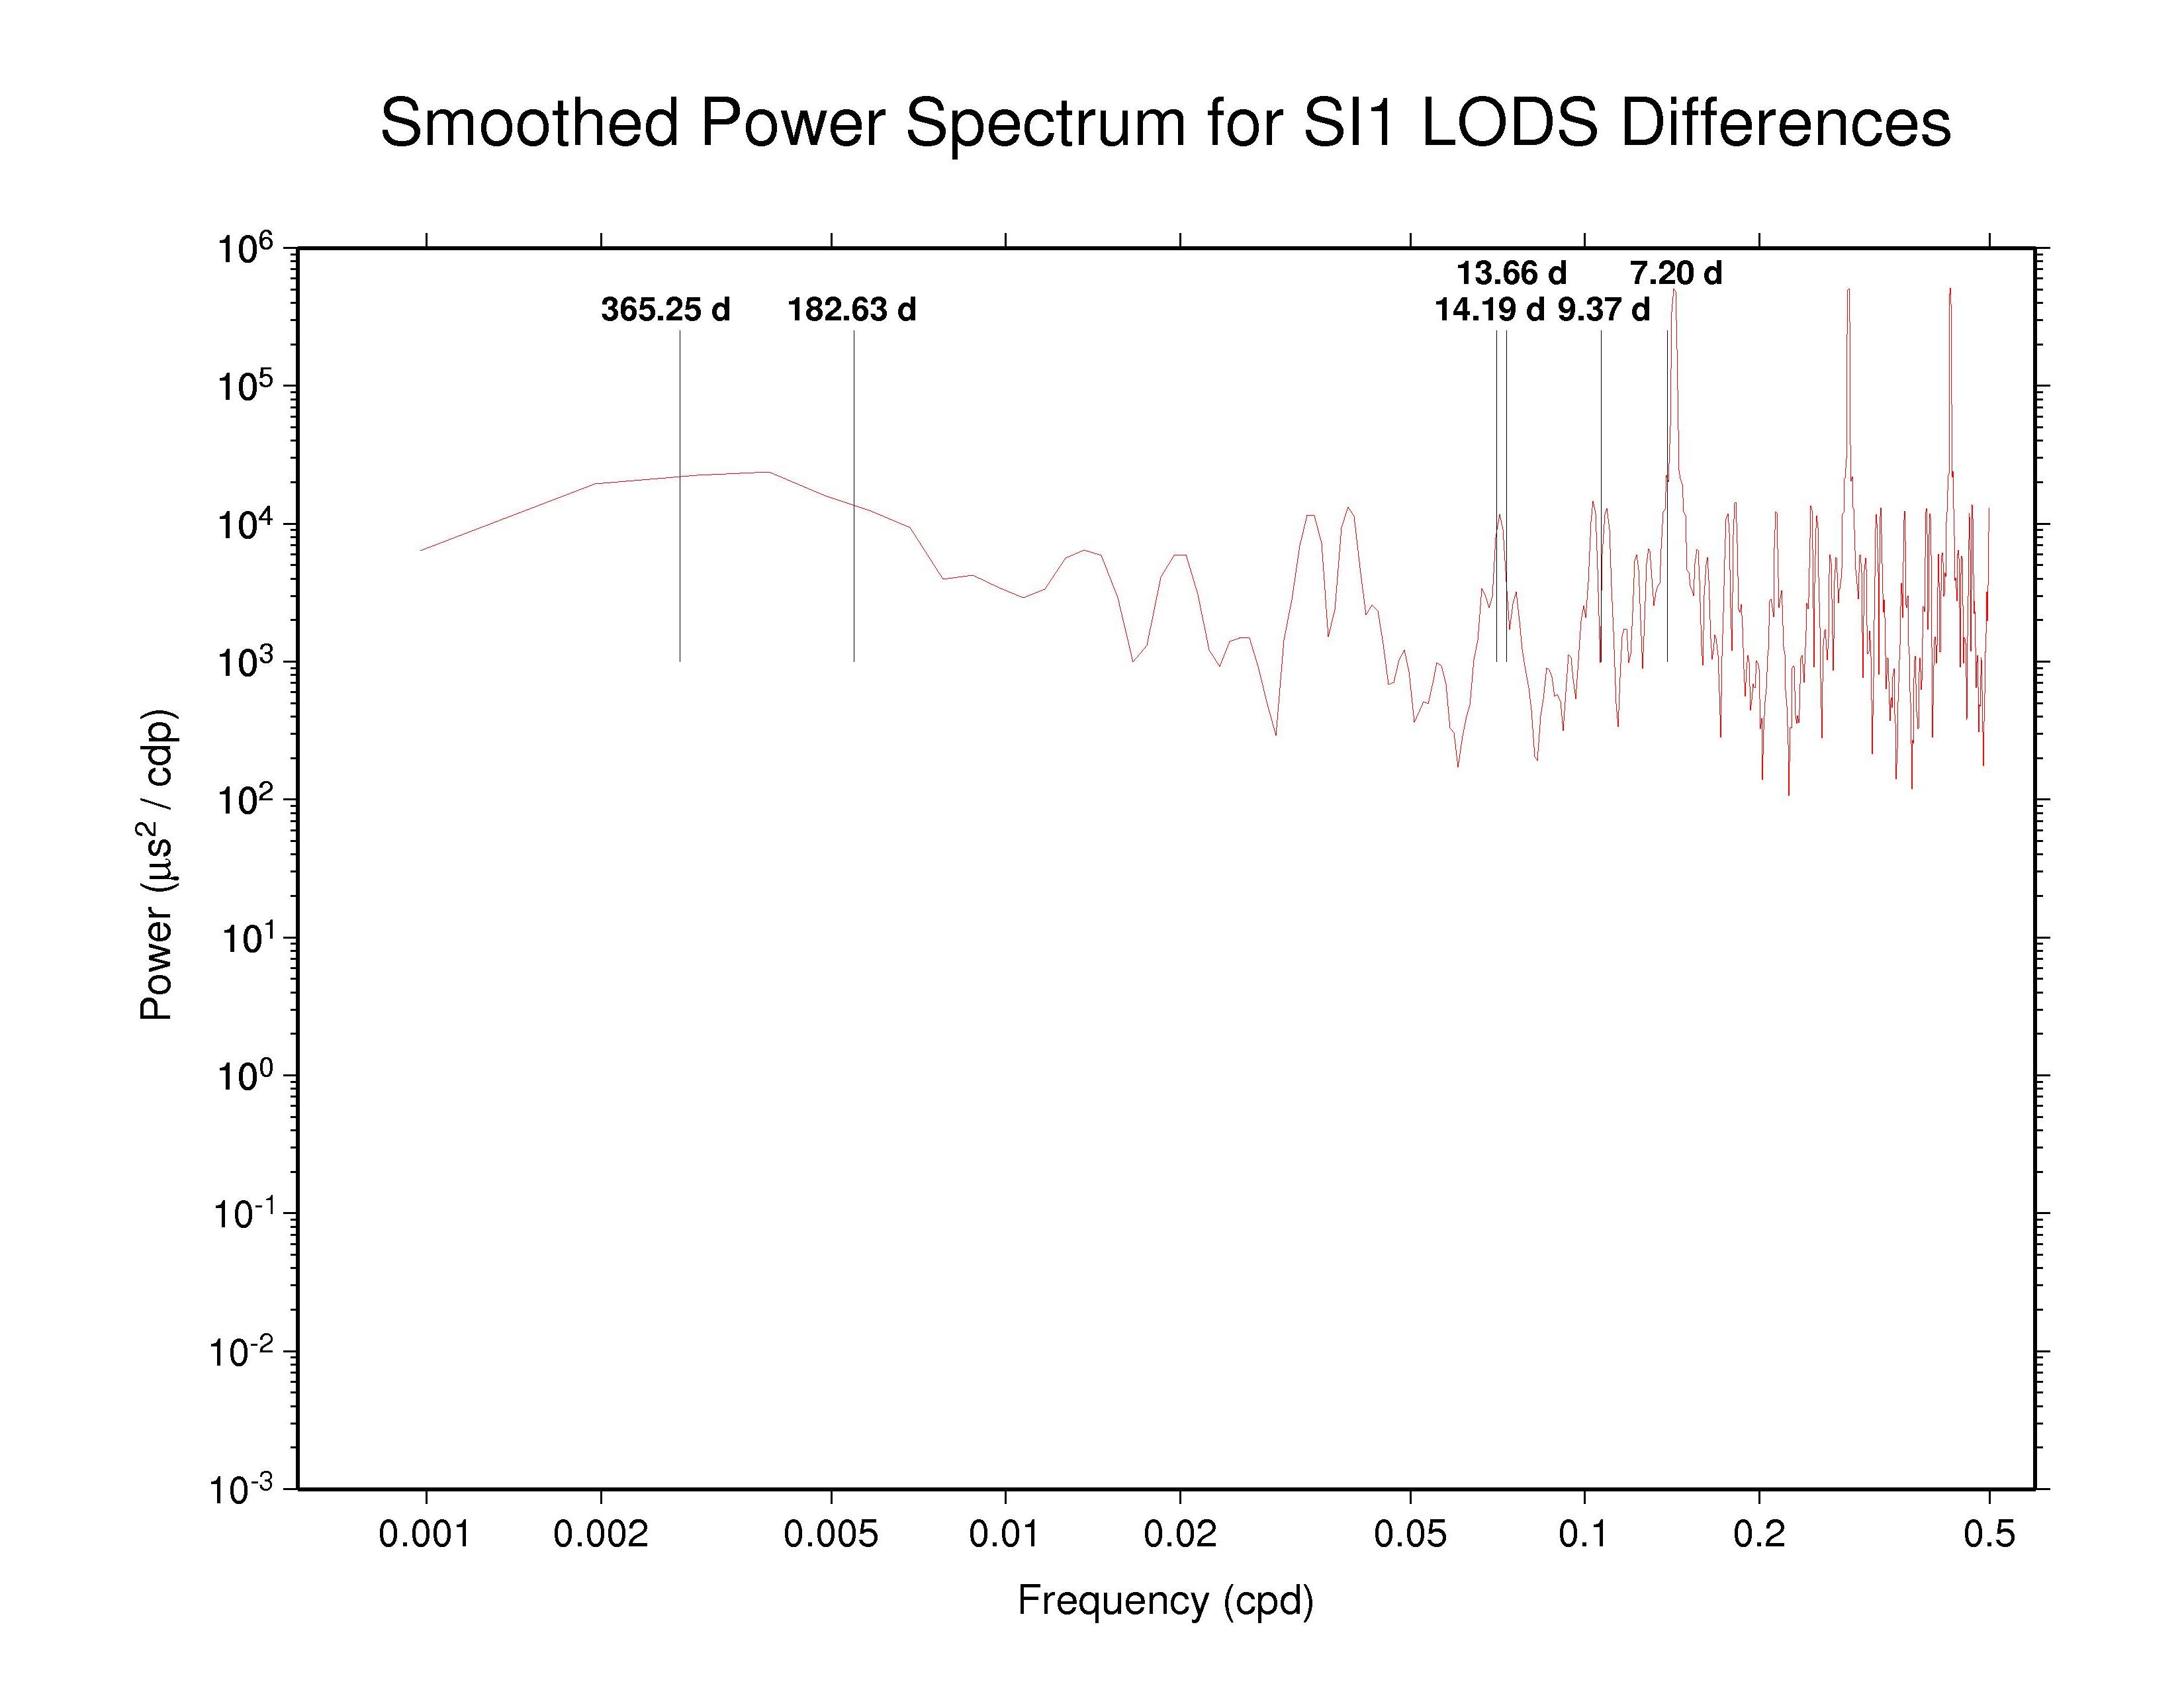
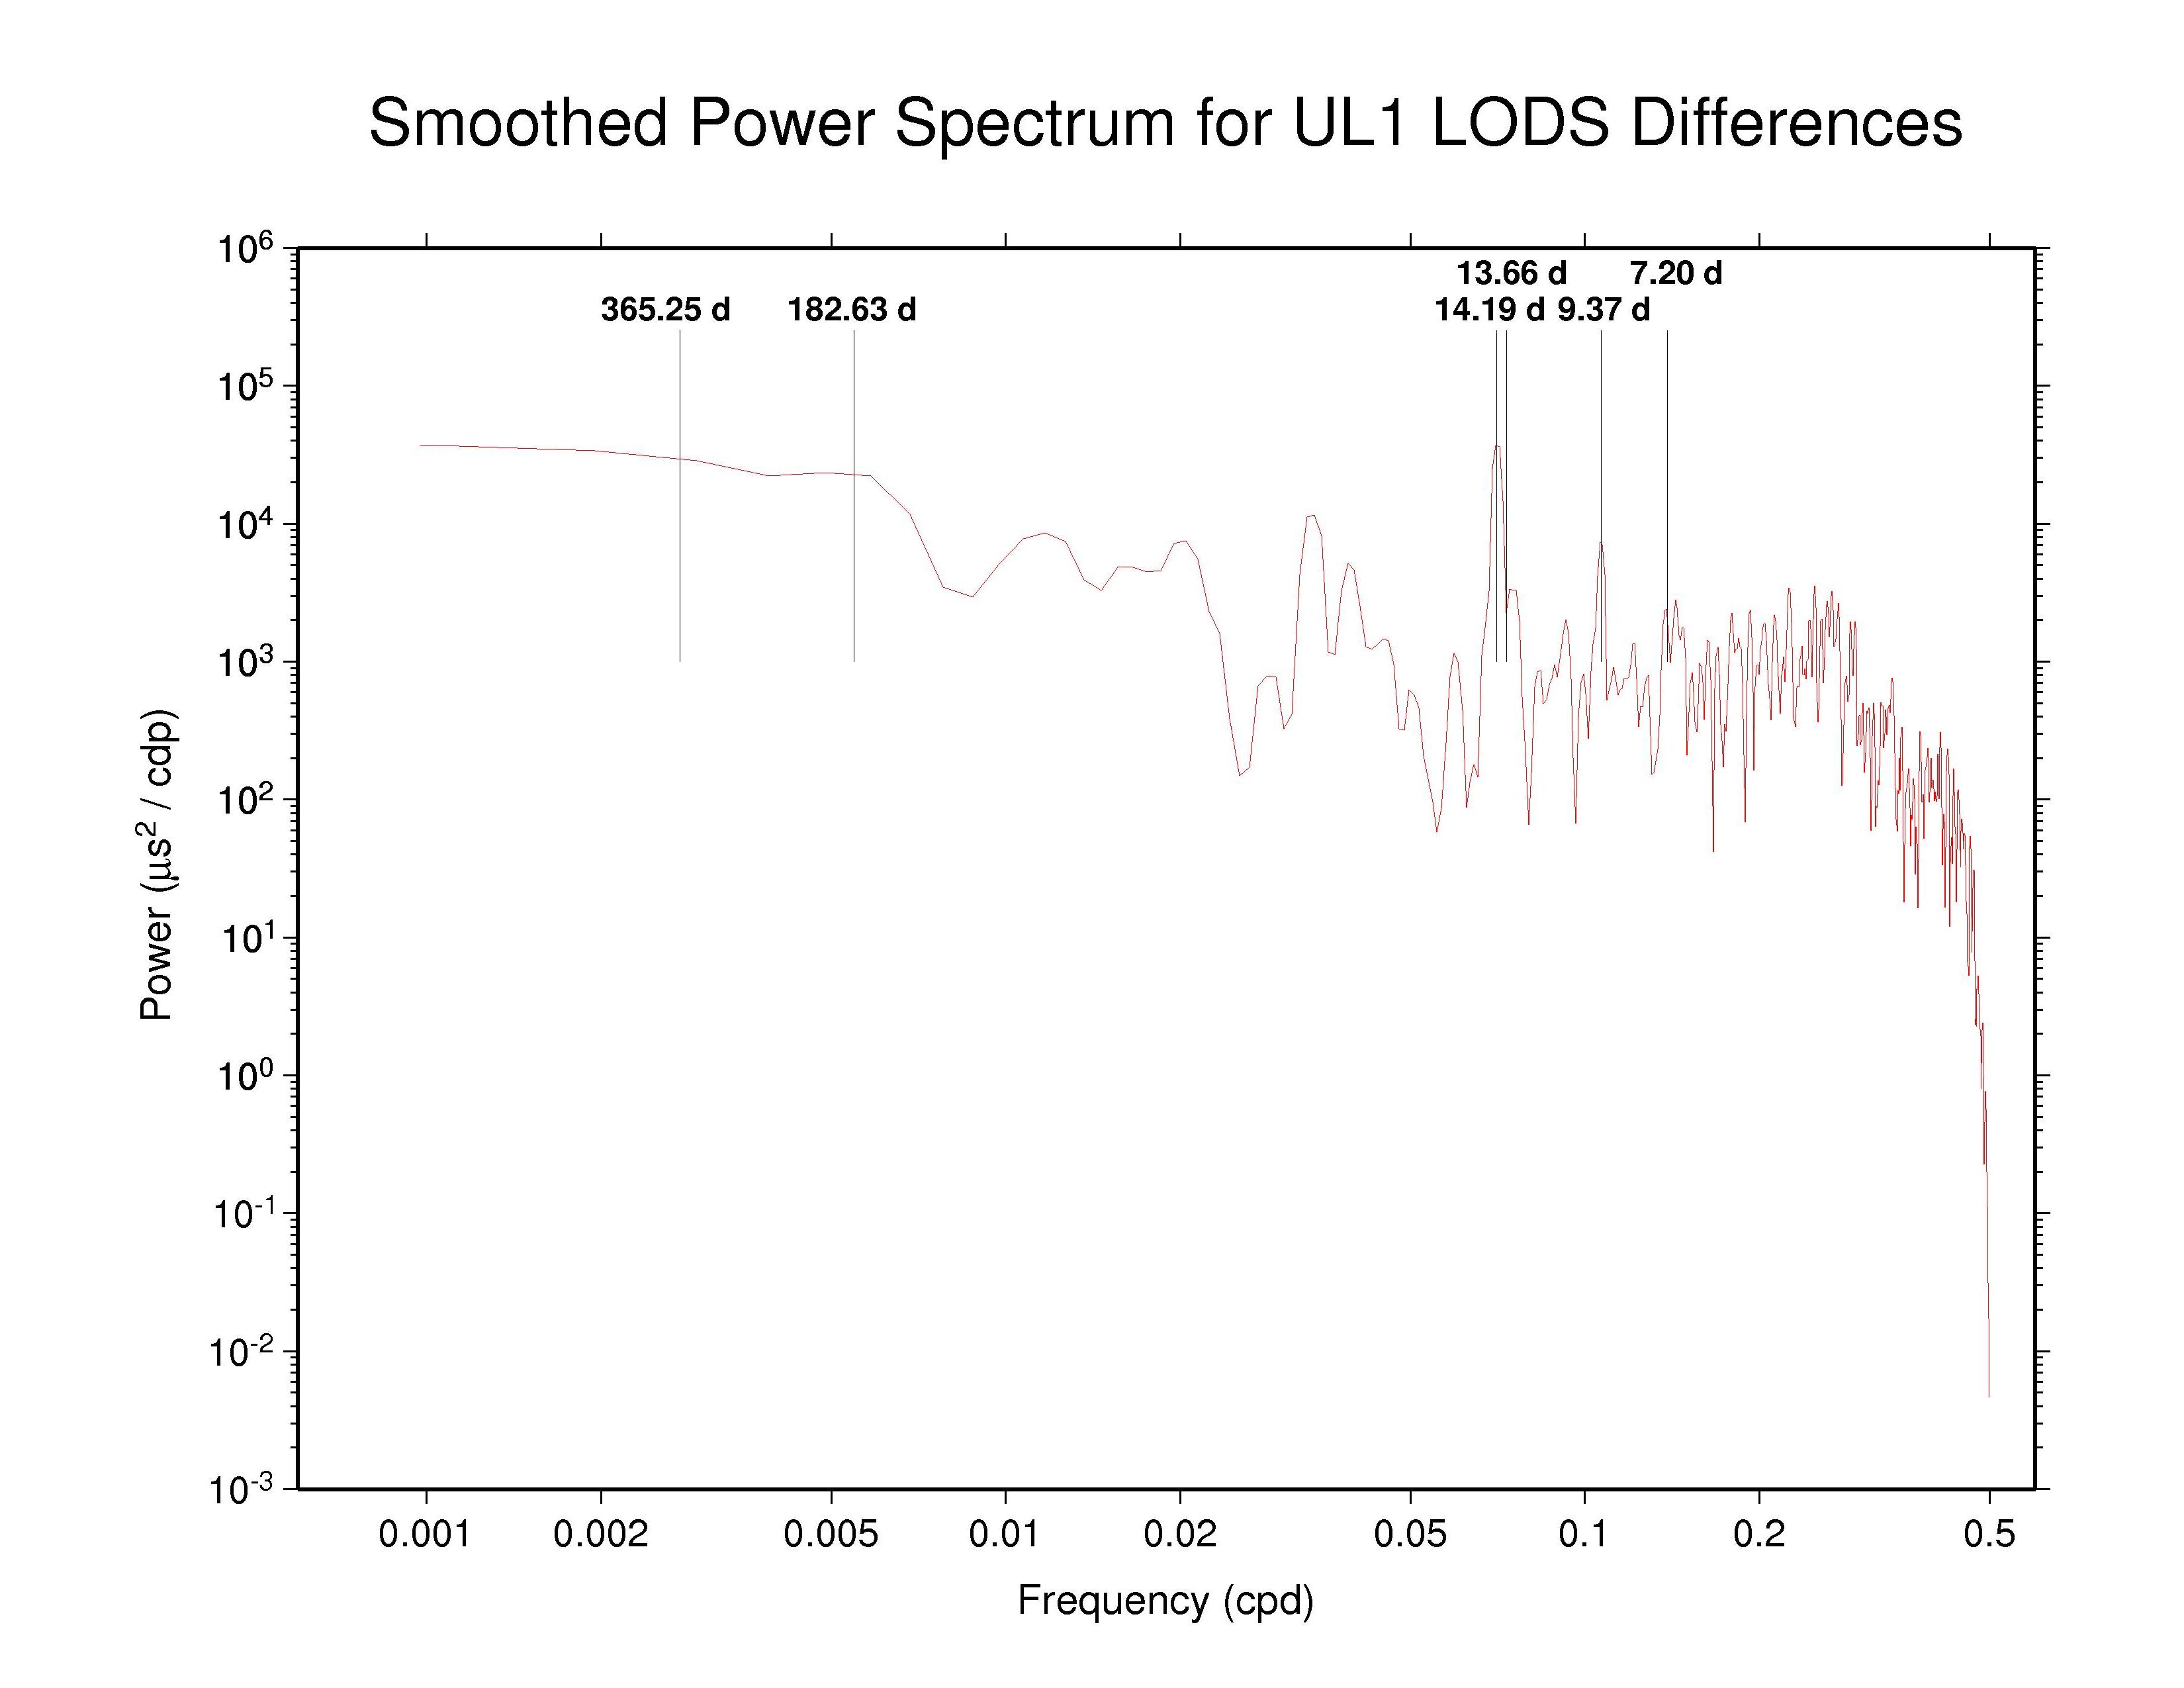
Spectra of UT1S/LODS Discontinuities at Day Boundaries
Spectra of the day-boundary differences in UT1S/LODS are plotted
below. In each case a boxcar filter has been used to smooth across
each three adjacent frequencies. Some interesting spectral lines are
also marked in each plot. The annual, semi-annual, 14.19 d, 9.37 d,
and 7.20 d lines are the periods where alias features of errors in
the subdaily tidal EOP model are expected due to the terms K1/P1/T2,
K2/ψ1, O1, Q1, and σ1, respectively. A variety of other
effects could also contribute to features near the annual and
semi-annual periods. The 13.66 d period marks one of the largest zonal
tidal lines, for which the UT1S/LODS correction model might be
inaccurate.
 IGS —
ps file IGS —
ps file
|
 CODE —
ps file CODE —
ps file
|
 EMR —
ps file EMR —
ps file
|
 ESA —
ps file ESA —
ps file
|
 GFZ —
ps file GFZ —
ps file
|
 GTZ —
ps file GTZ —
ps file
|
 JPL —
ps file JPL —
ps file
|
 MIT —
ps file MIT —
ps file
|
 NGS —
ps file NGS —
ps file
|
 PDR —
ps file PDR —
ps file
|
 SIO —
ps file SIO —
ps file
|
 ULR —
ps file ULR —
ps file
|
Evidence for aliased subdaily EOP model errors is apparent in most AC and the IGS combined spectra at the 14.19 d, perhaps 9.37 d, and maybe semi-annual periods. Orbit-related errors could also be expected near the semi-annual period. Residual 13.66 d zonal tide power is probably present in some spectra. The IGS discontinuities are very strong smoothed near the Nyquist limit, evidently due to the ESA, JPL, and/or ULR contributions.
CODE, GFZ, GTZ, PDR, SIO, and perhaps MIT all have interesting dense spectral features around the weekly period and its second and third harmonics, which is not surprising for a weekly fixation of UT1. For GFZ, however, these features match similar structures seen in their reprocessed day-boundary orbit discontinuities. (There may also be some impact on the PDR orbit discontinuities.) In principle, one might imagine that a causal relationship could operate in either direction. However, it seems more likely that weekly UT1 fixation has somehow affected the GFZ orbit nodes and induced corresponding errors in their orbits. (GTZ has not submitted reprocessed orbits.) The even starker weekly UT1S/LODS discontinuity resonances in the PDR spectra are less clearly expressed in their orbit spectra than for GFZ, possibly because the PDR UT1S/LODS discontinuity power levels are considerably lower than for GFZ. So rather than inducing clear features in the PDR orbit spectra, the UT1 fixation effect appears only as an excess of high-frequency orbit scatter. The SIO and MIT orbits are free of any such UT1-related effects.
| Send comments to Jim Ray | (updated 14 May 2009) |