 |
|
|
| |
|
|
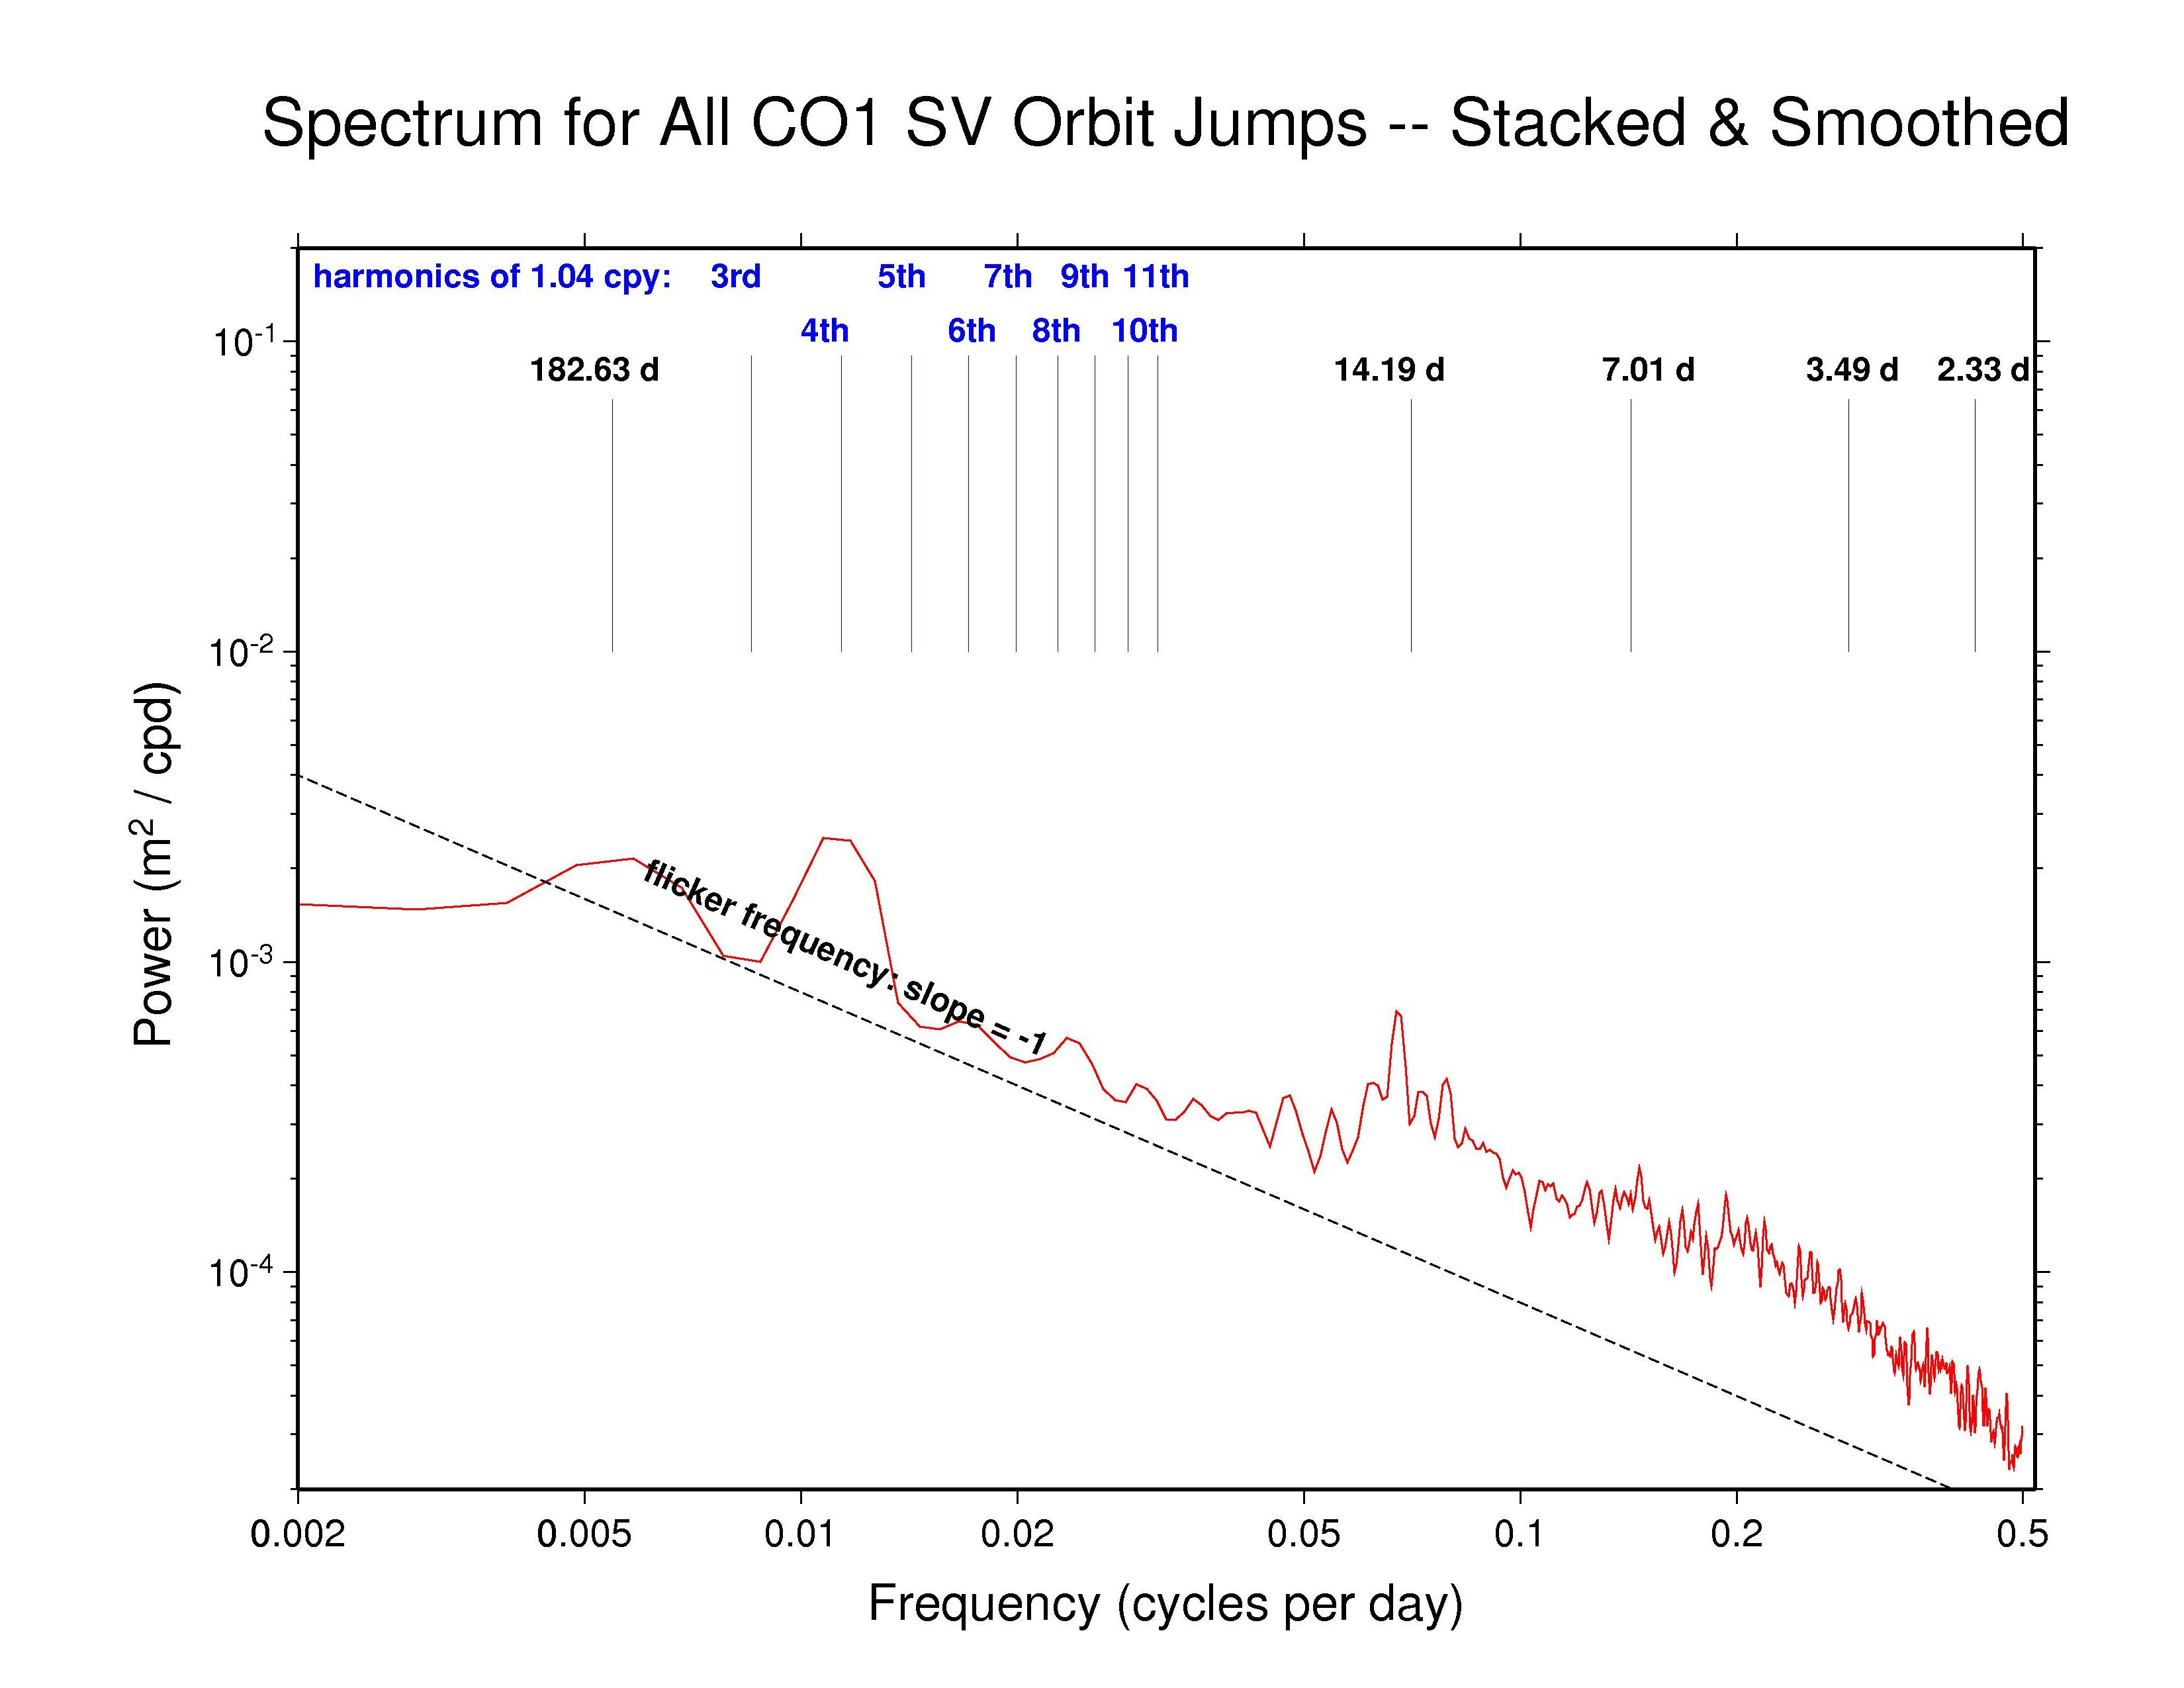
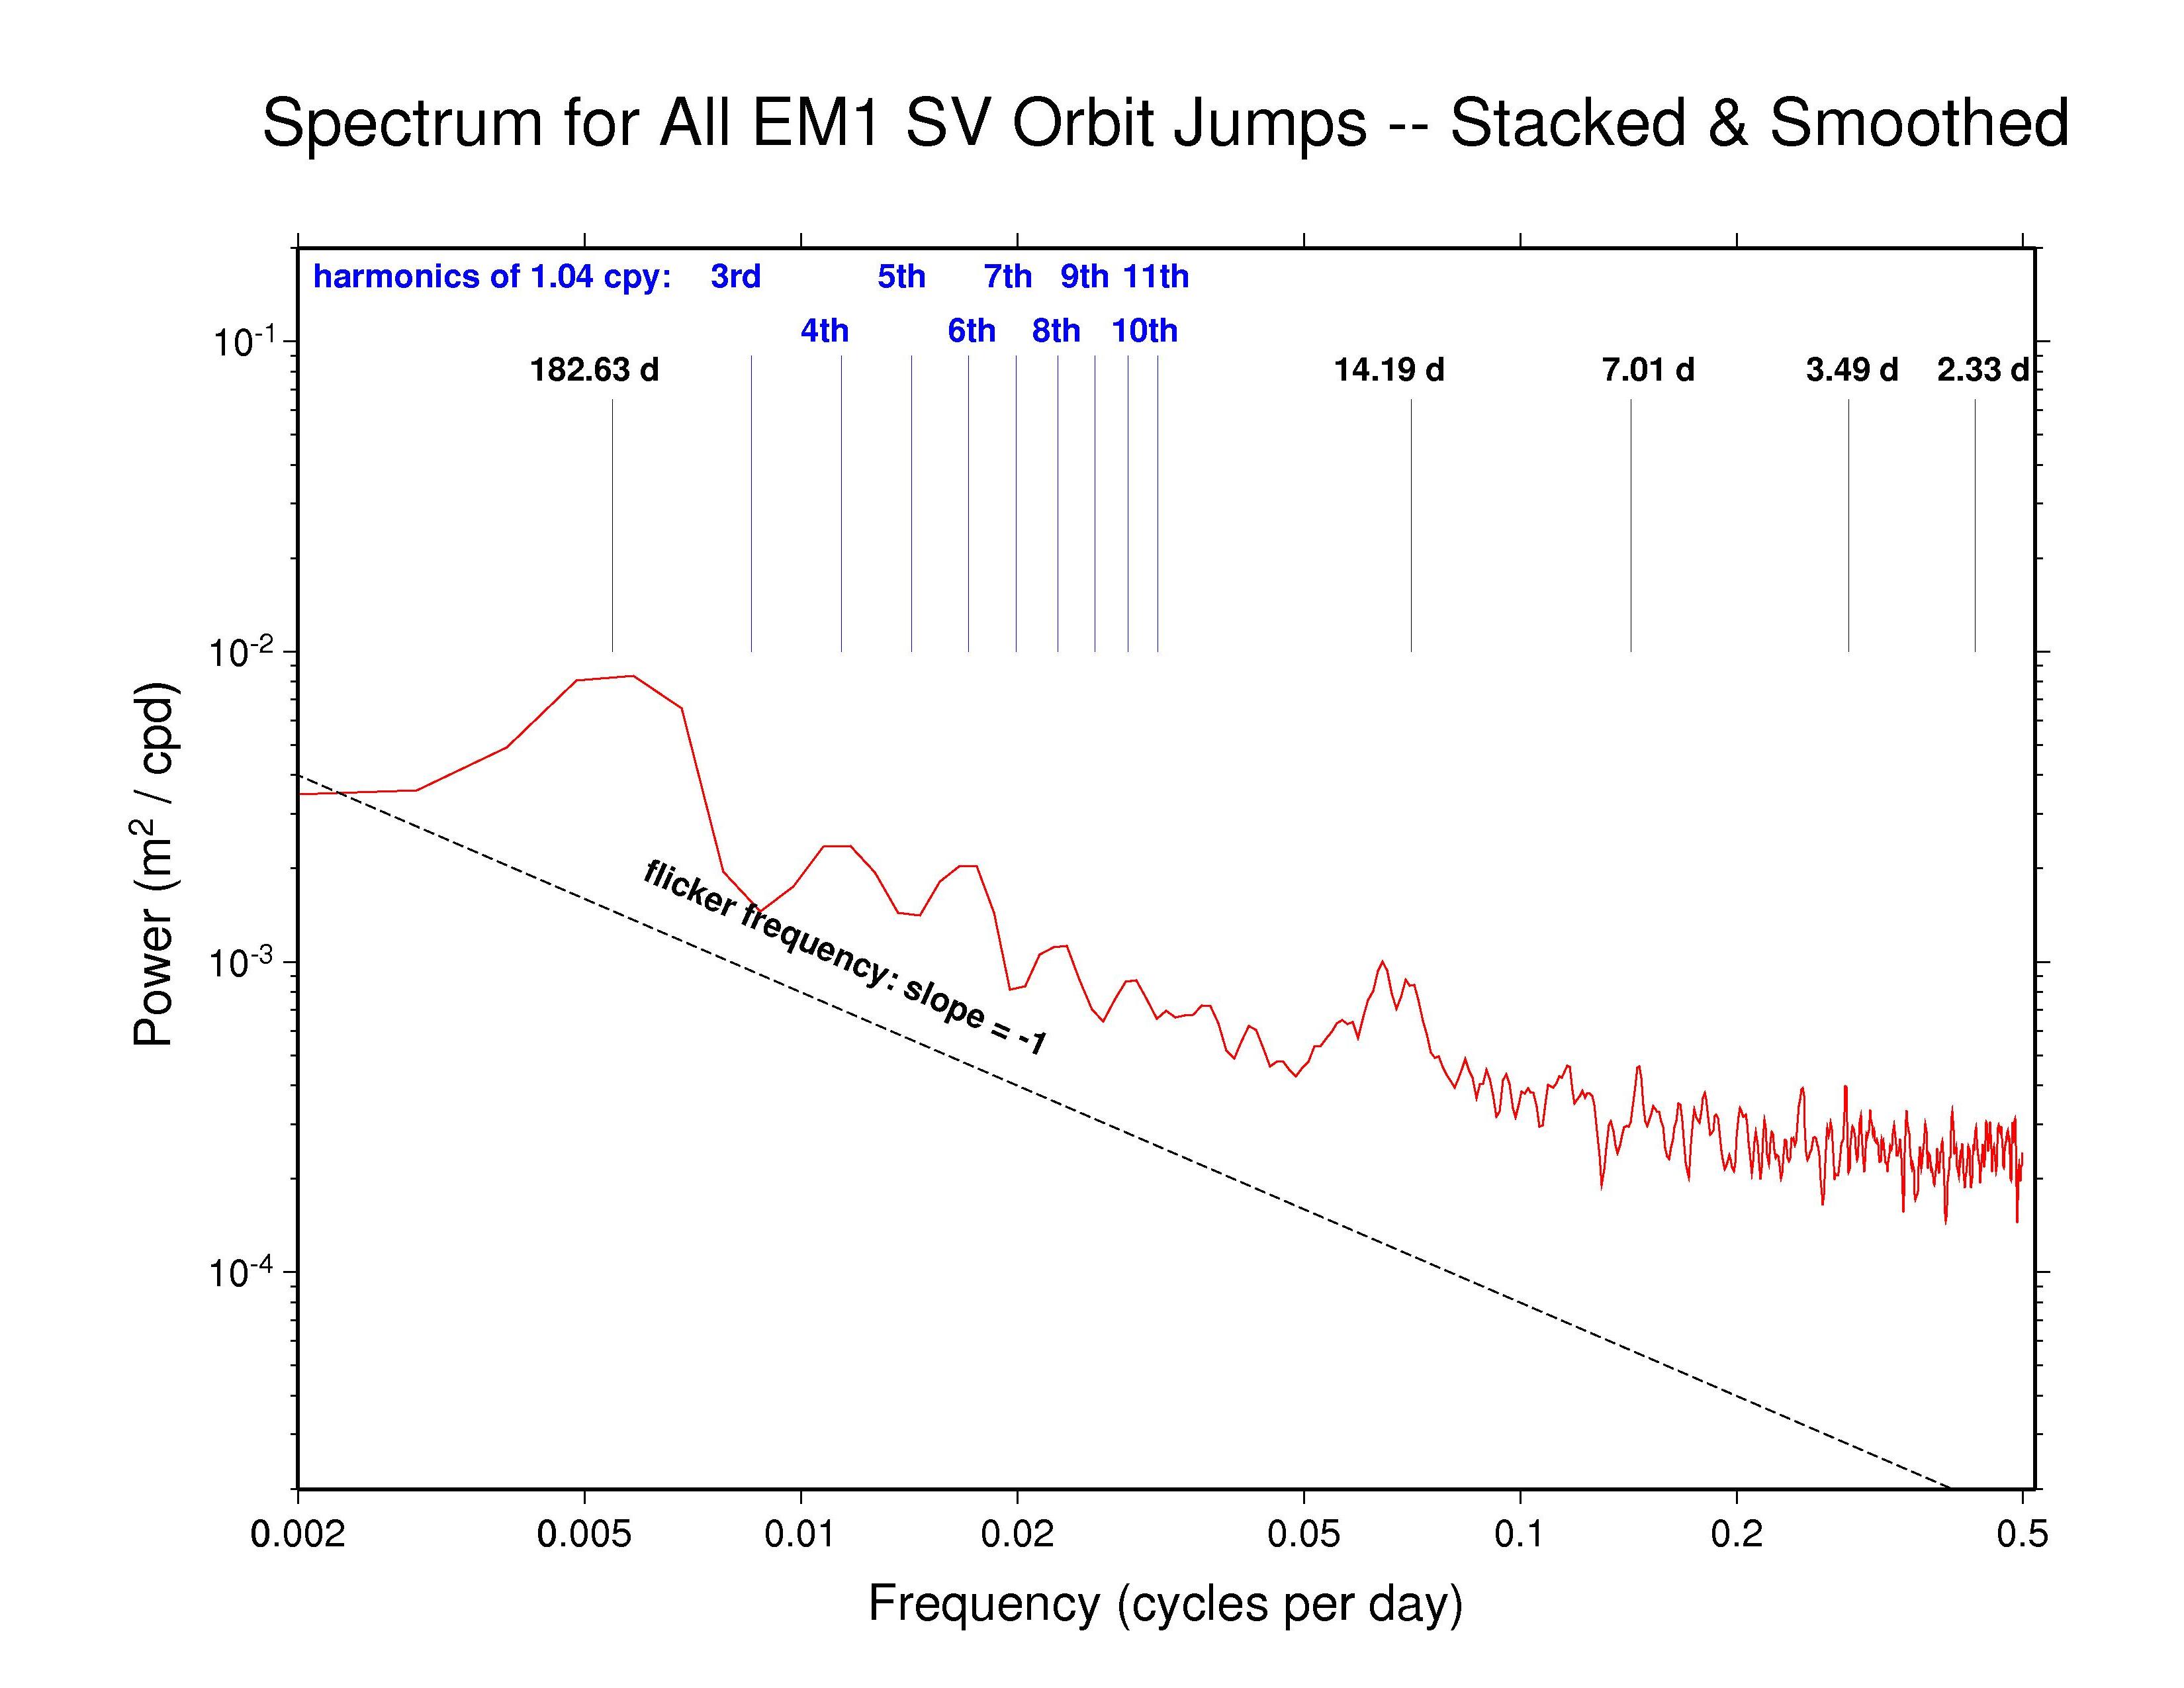
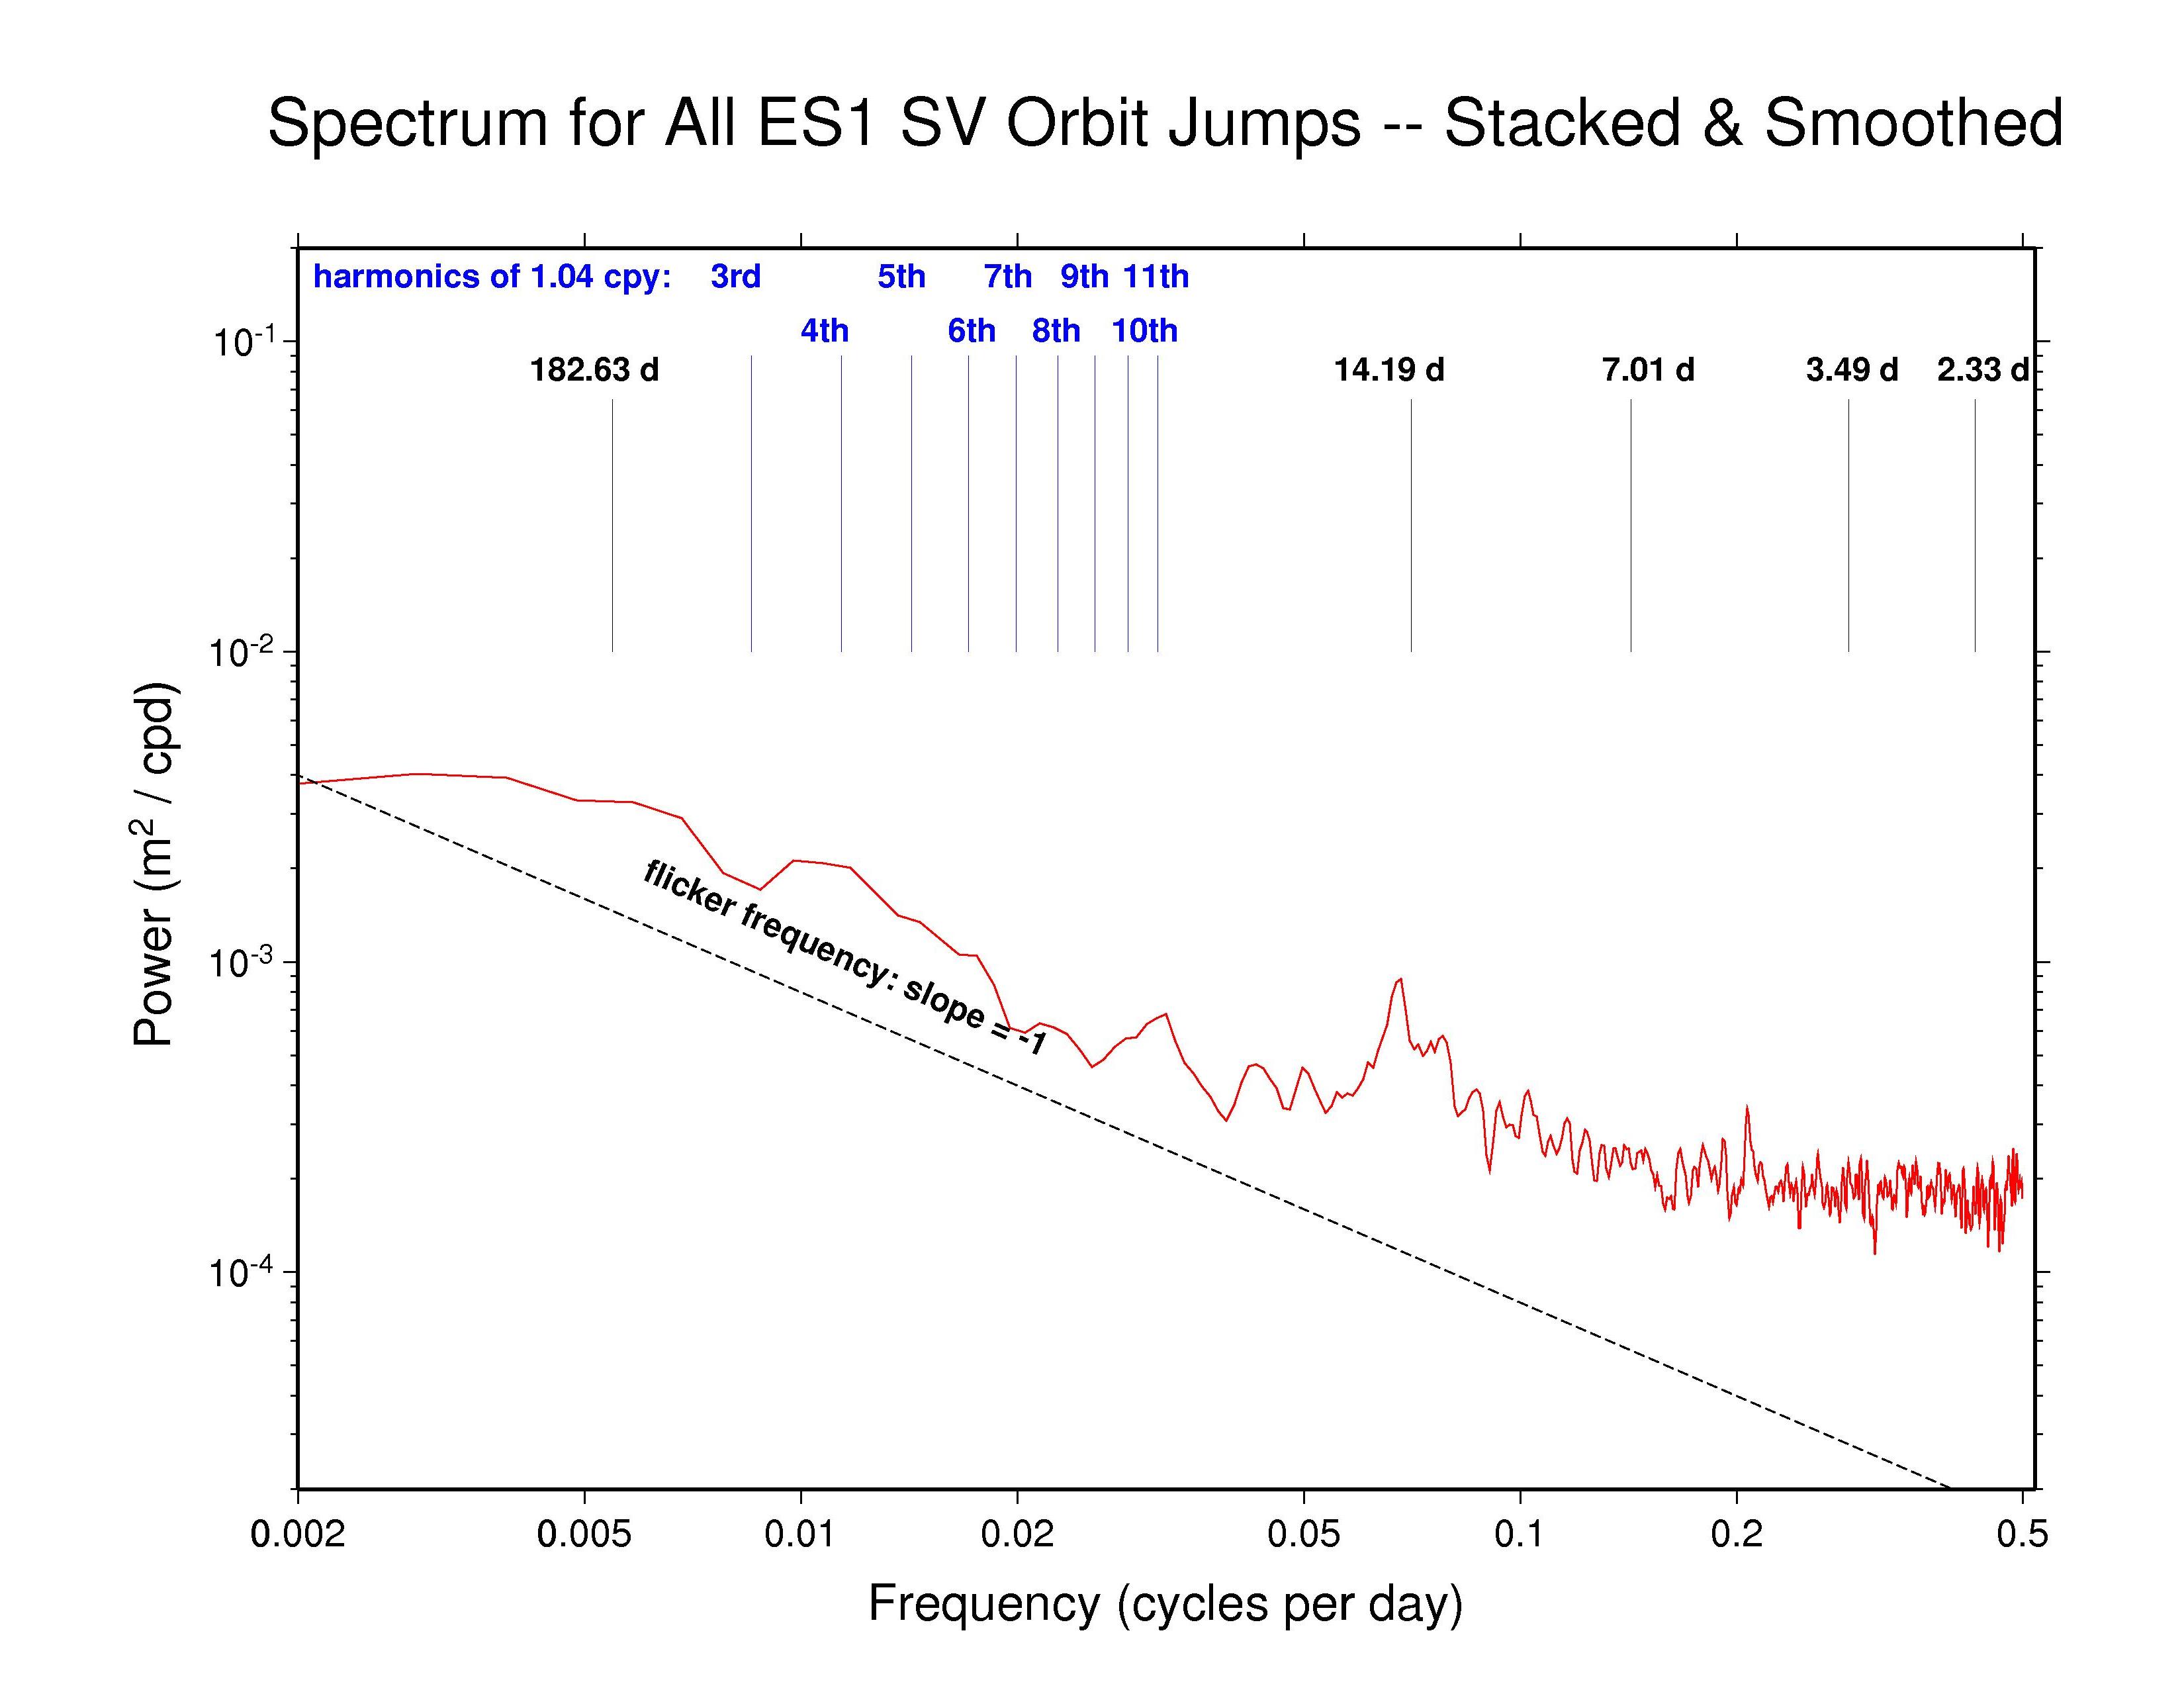
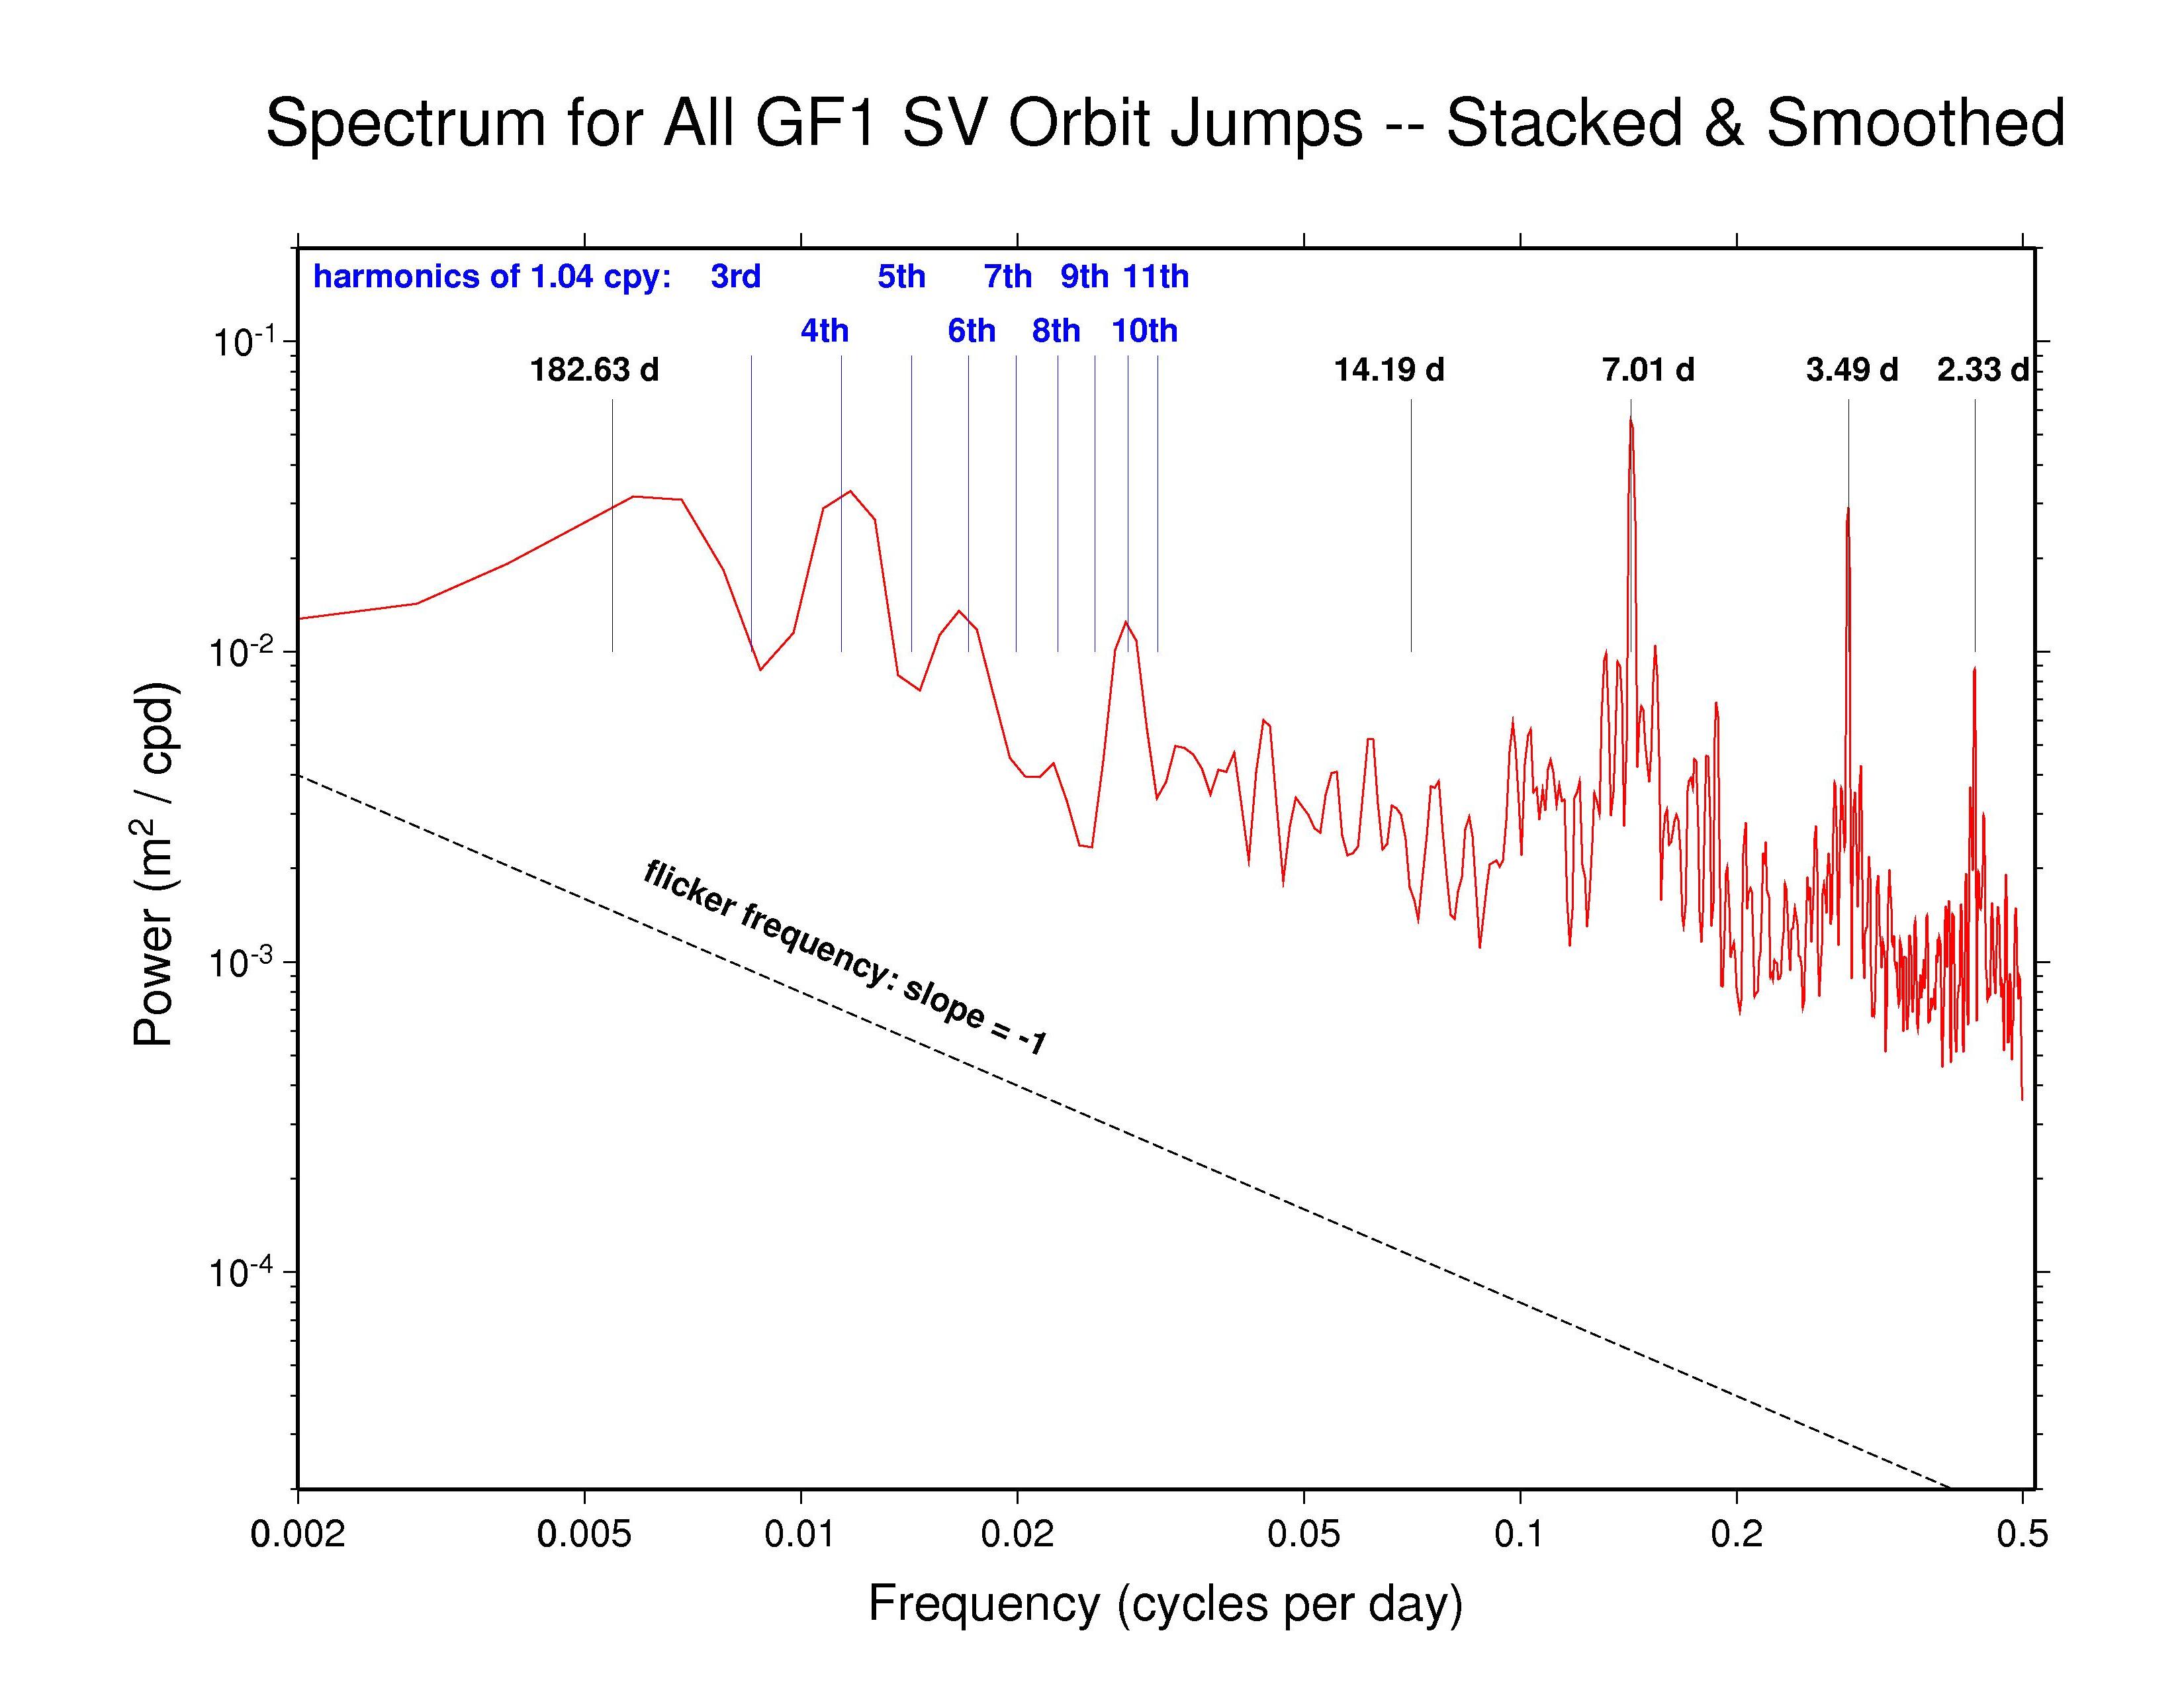
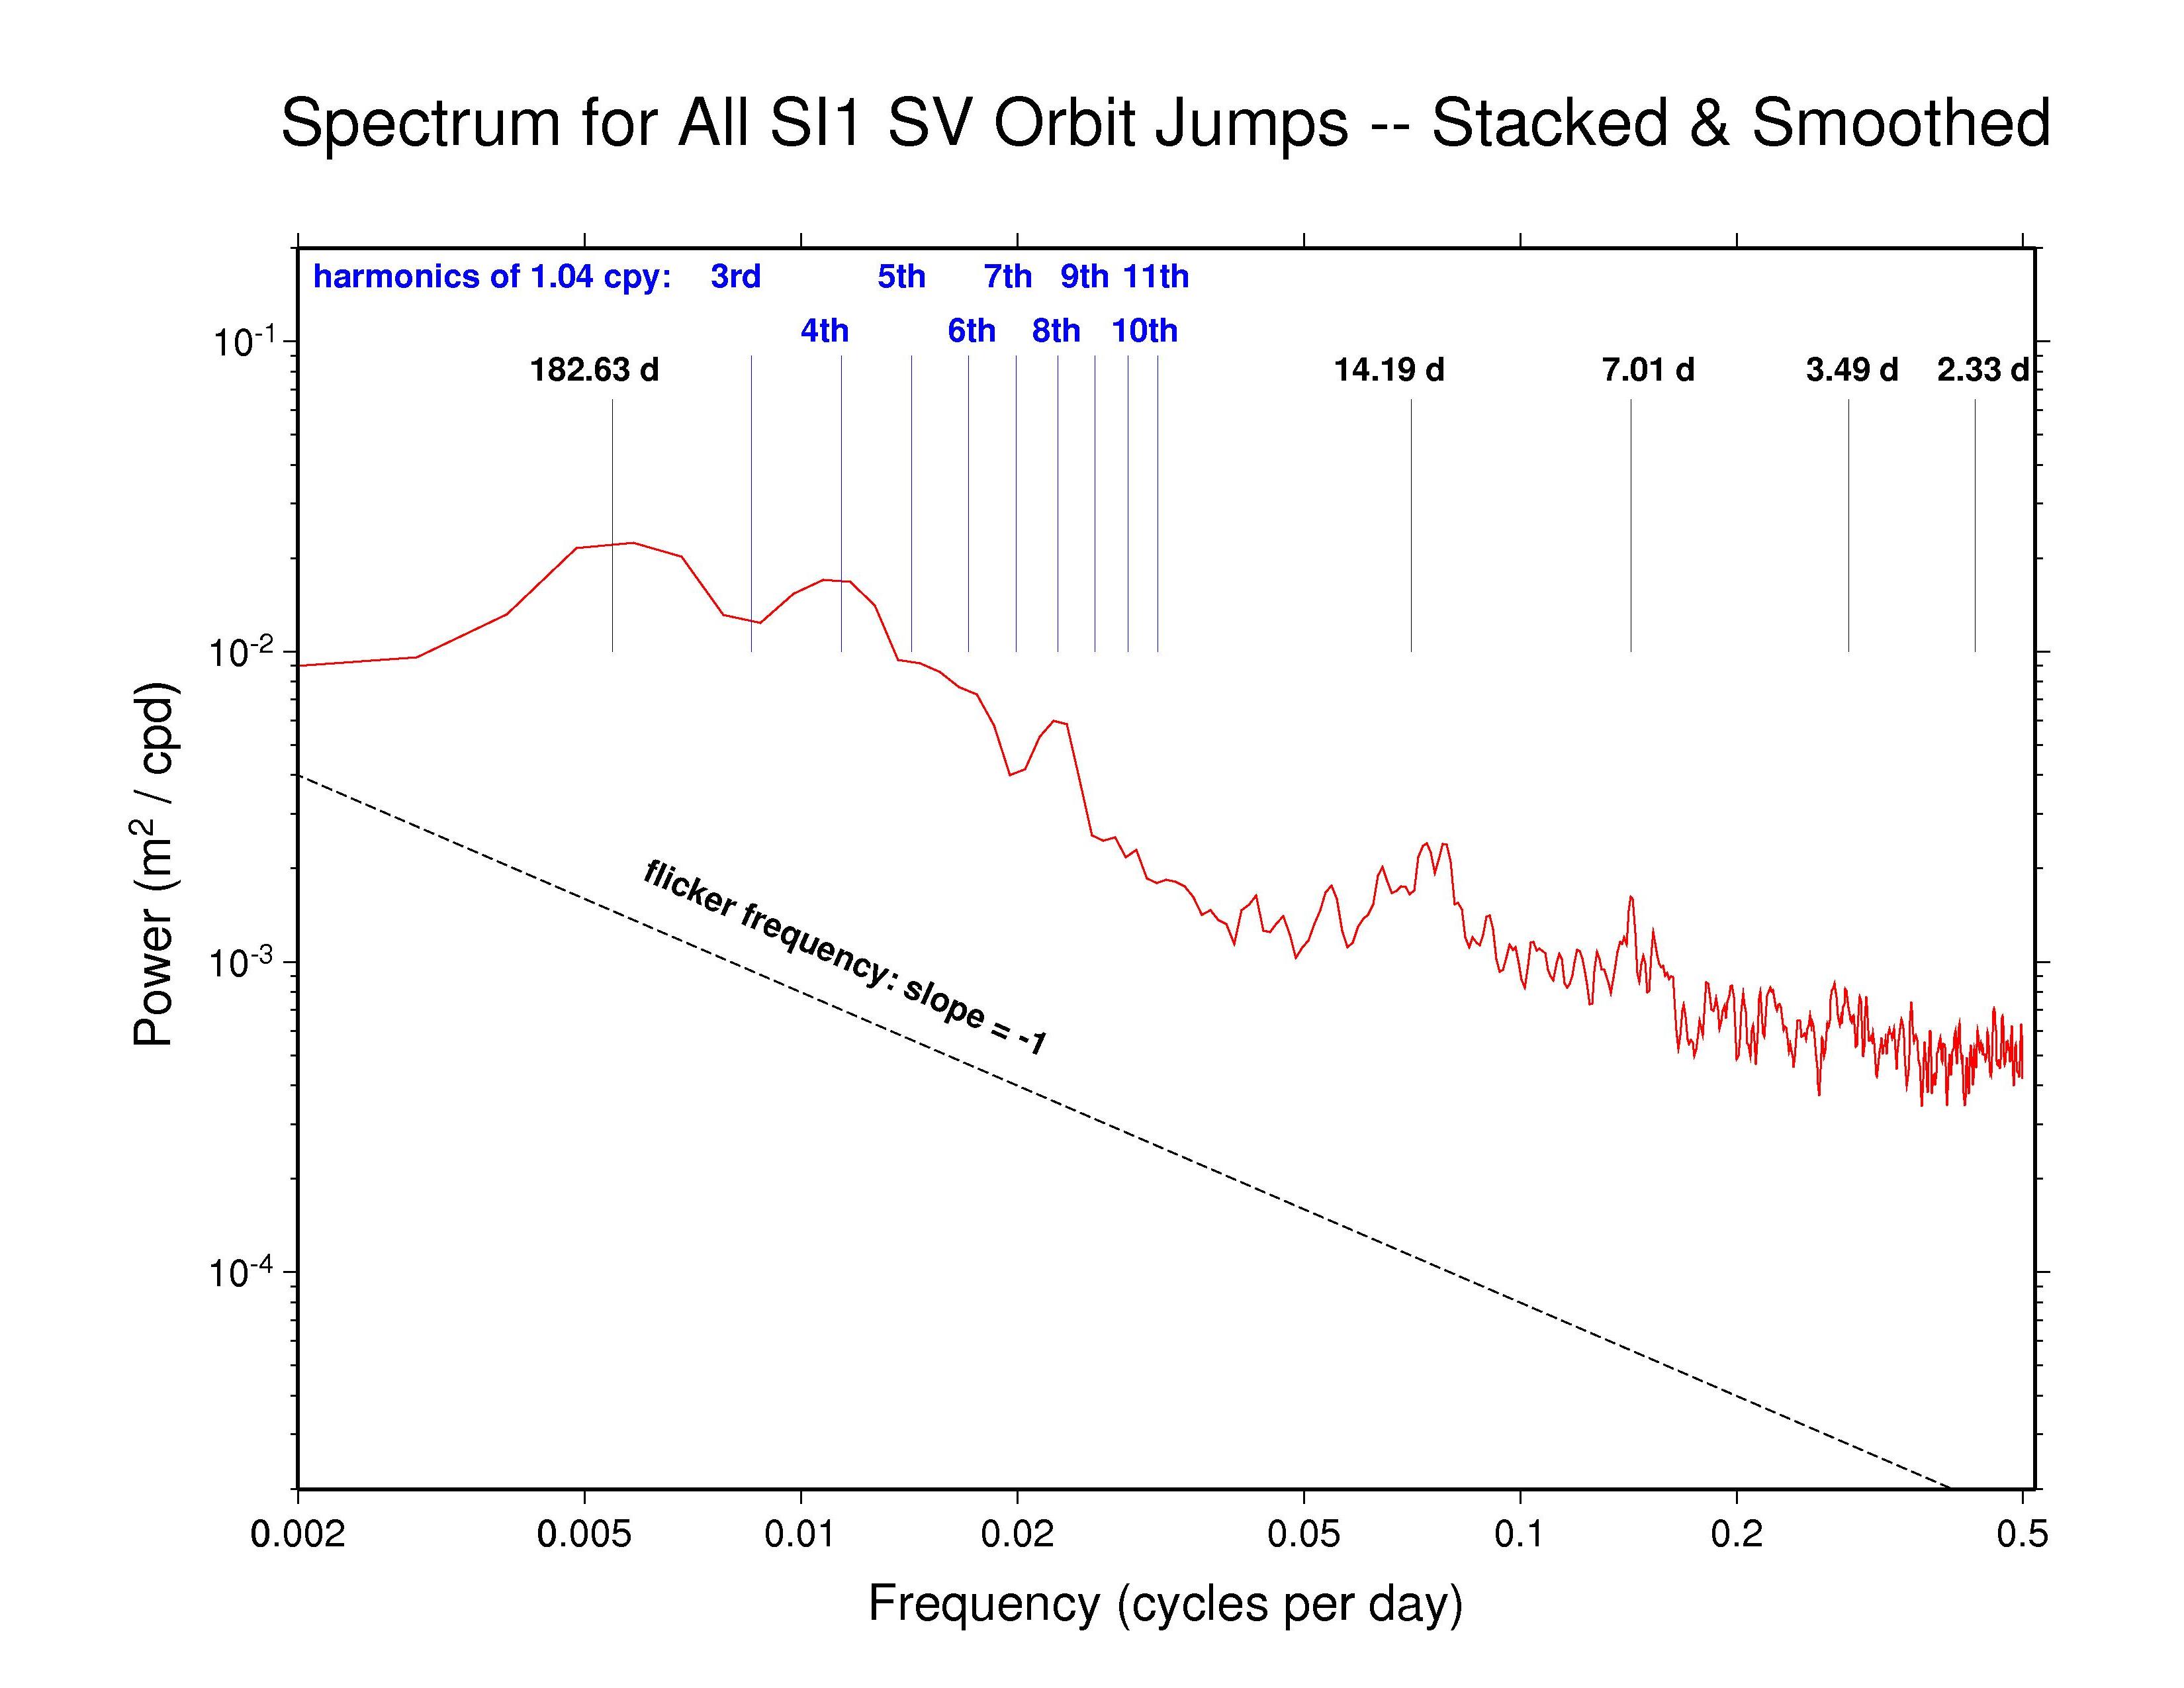
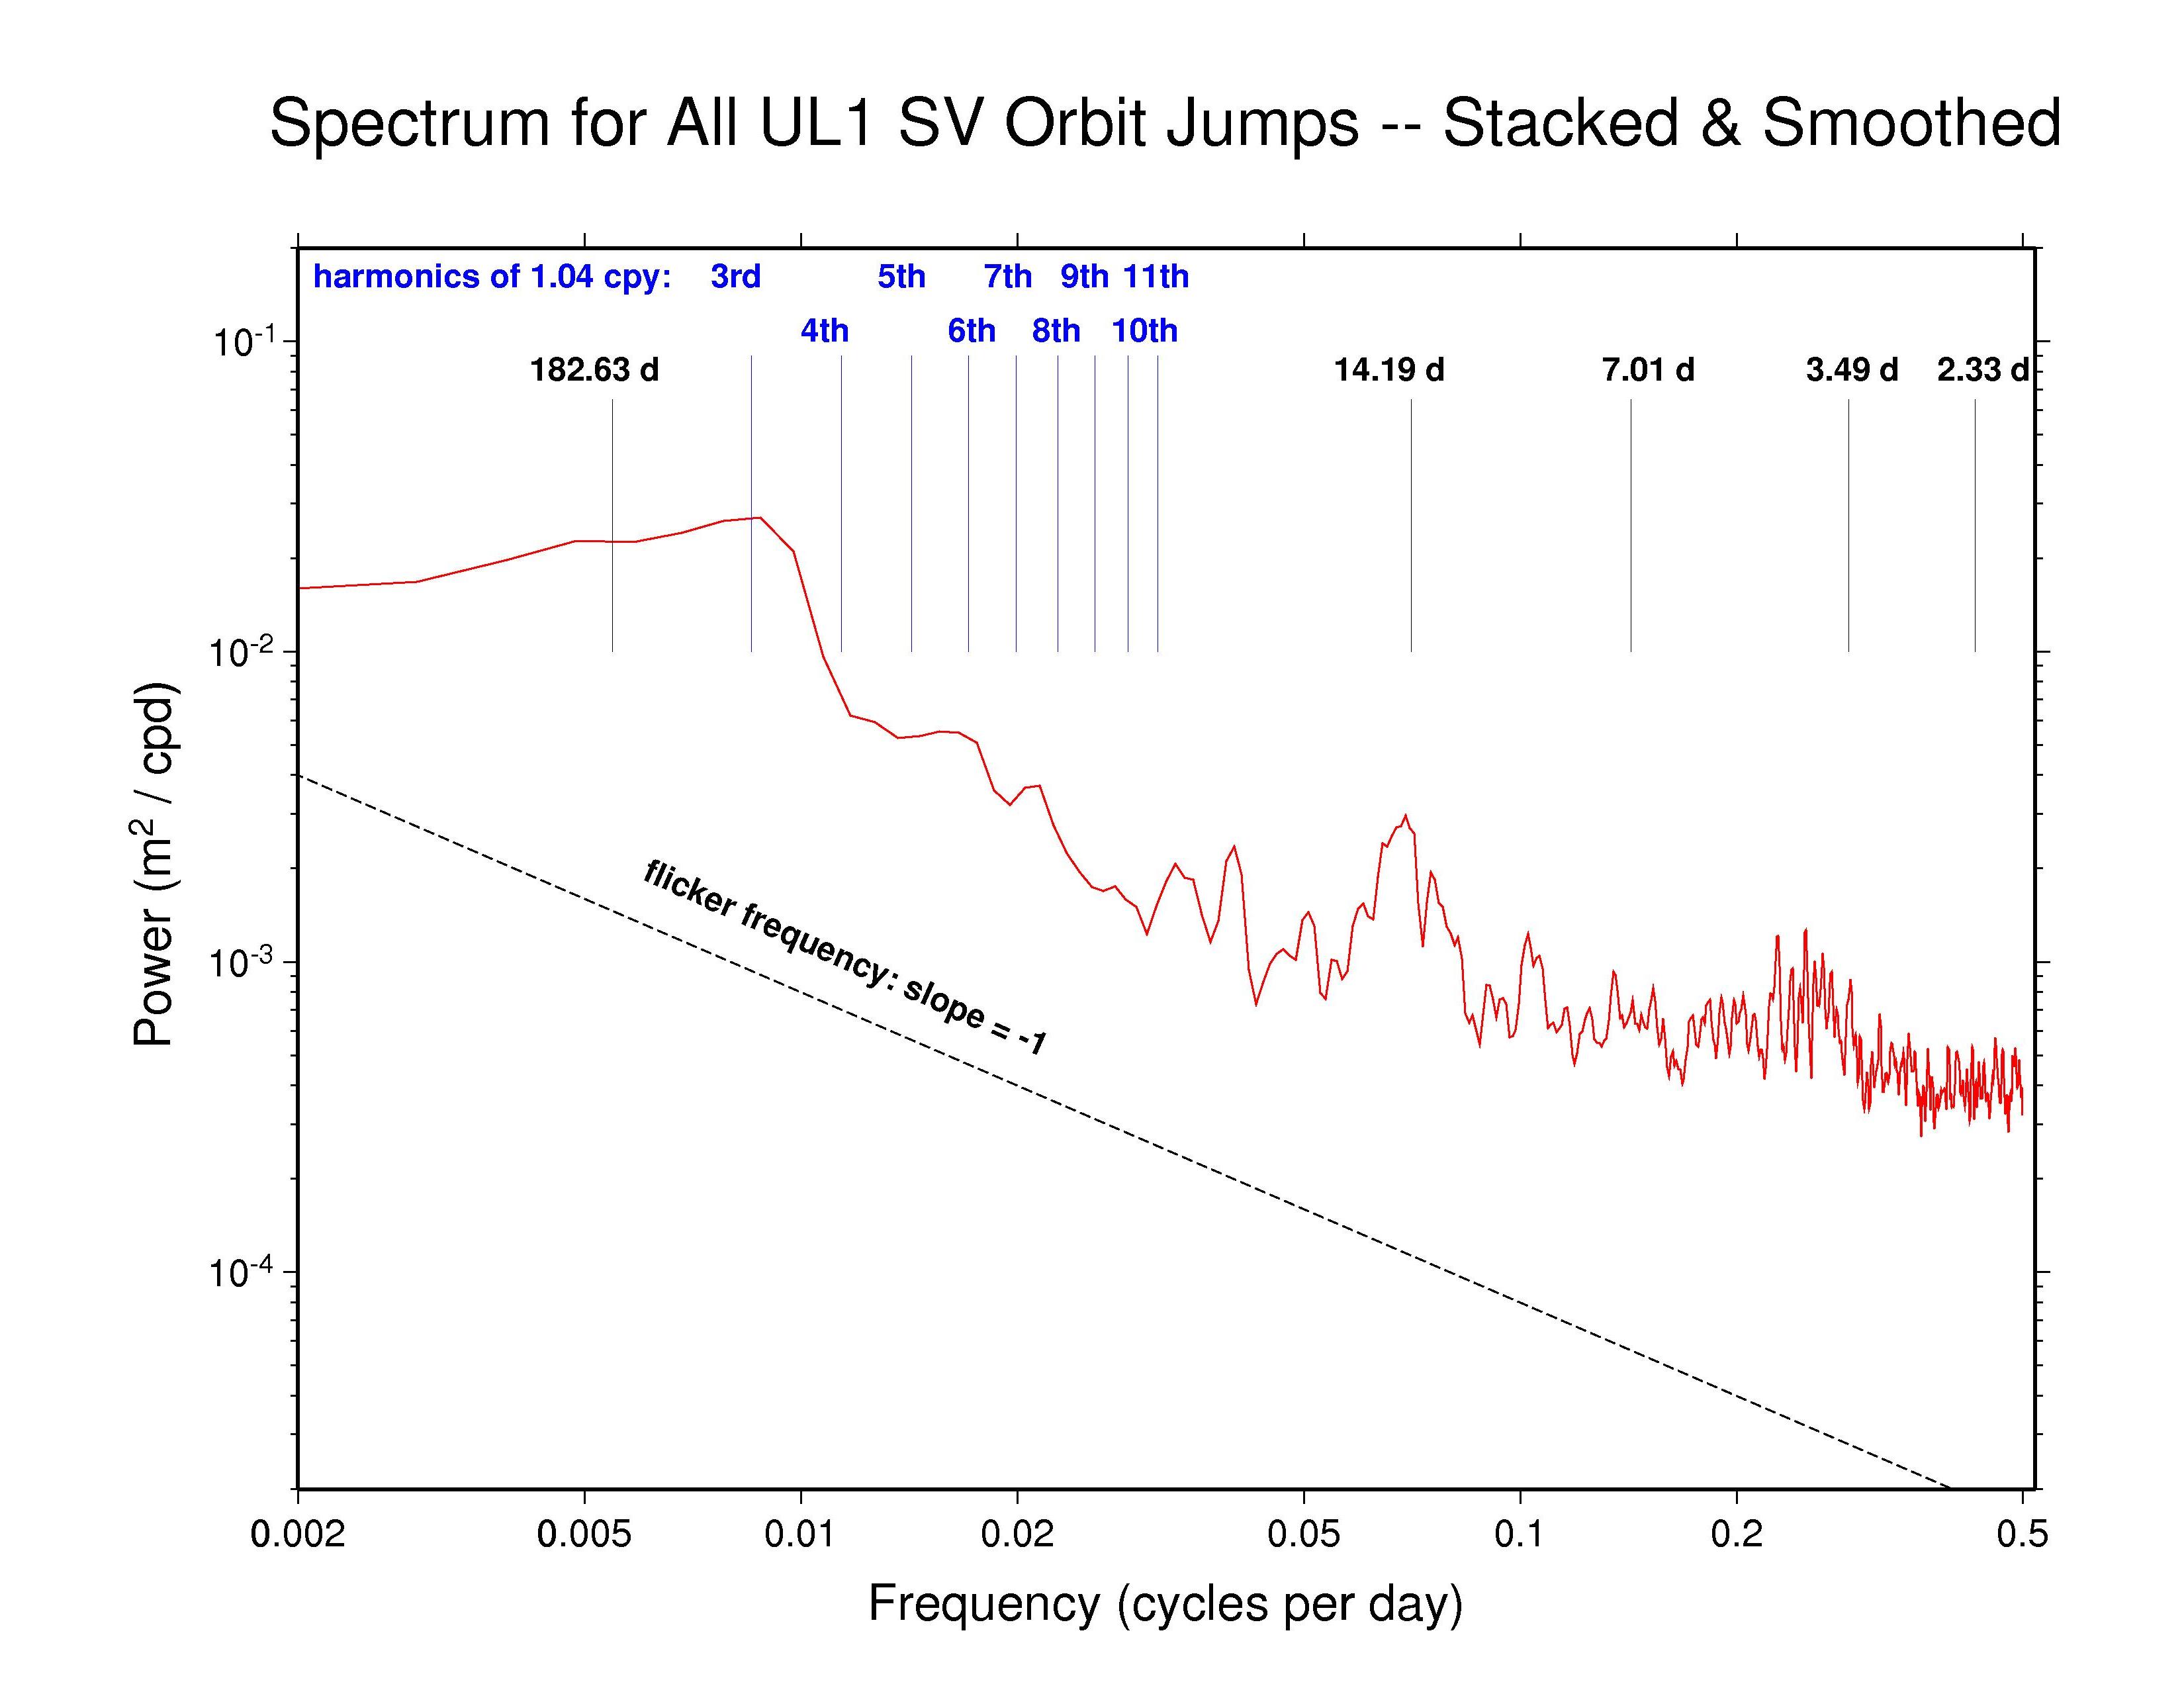
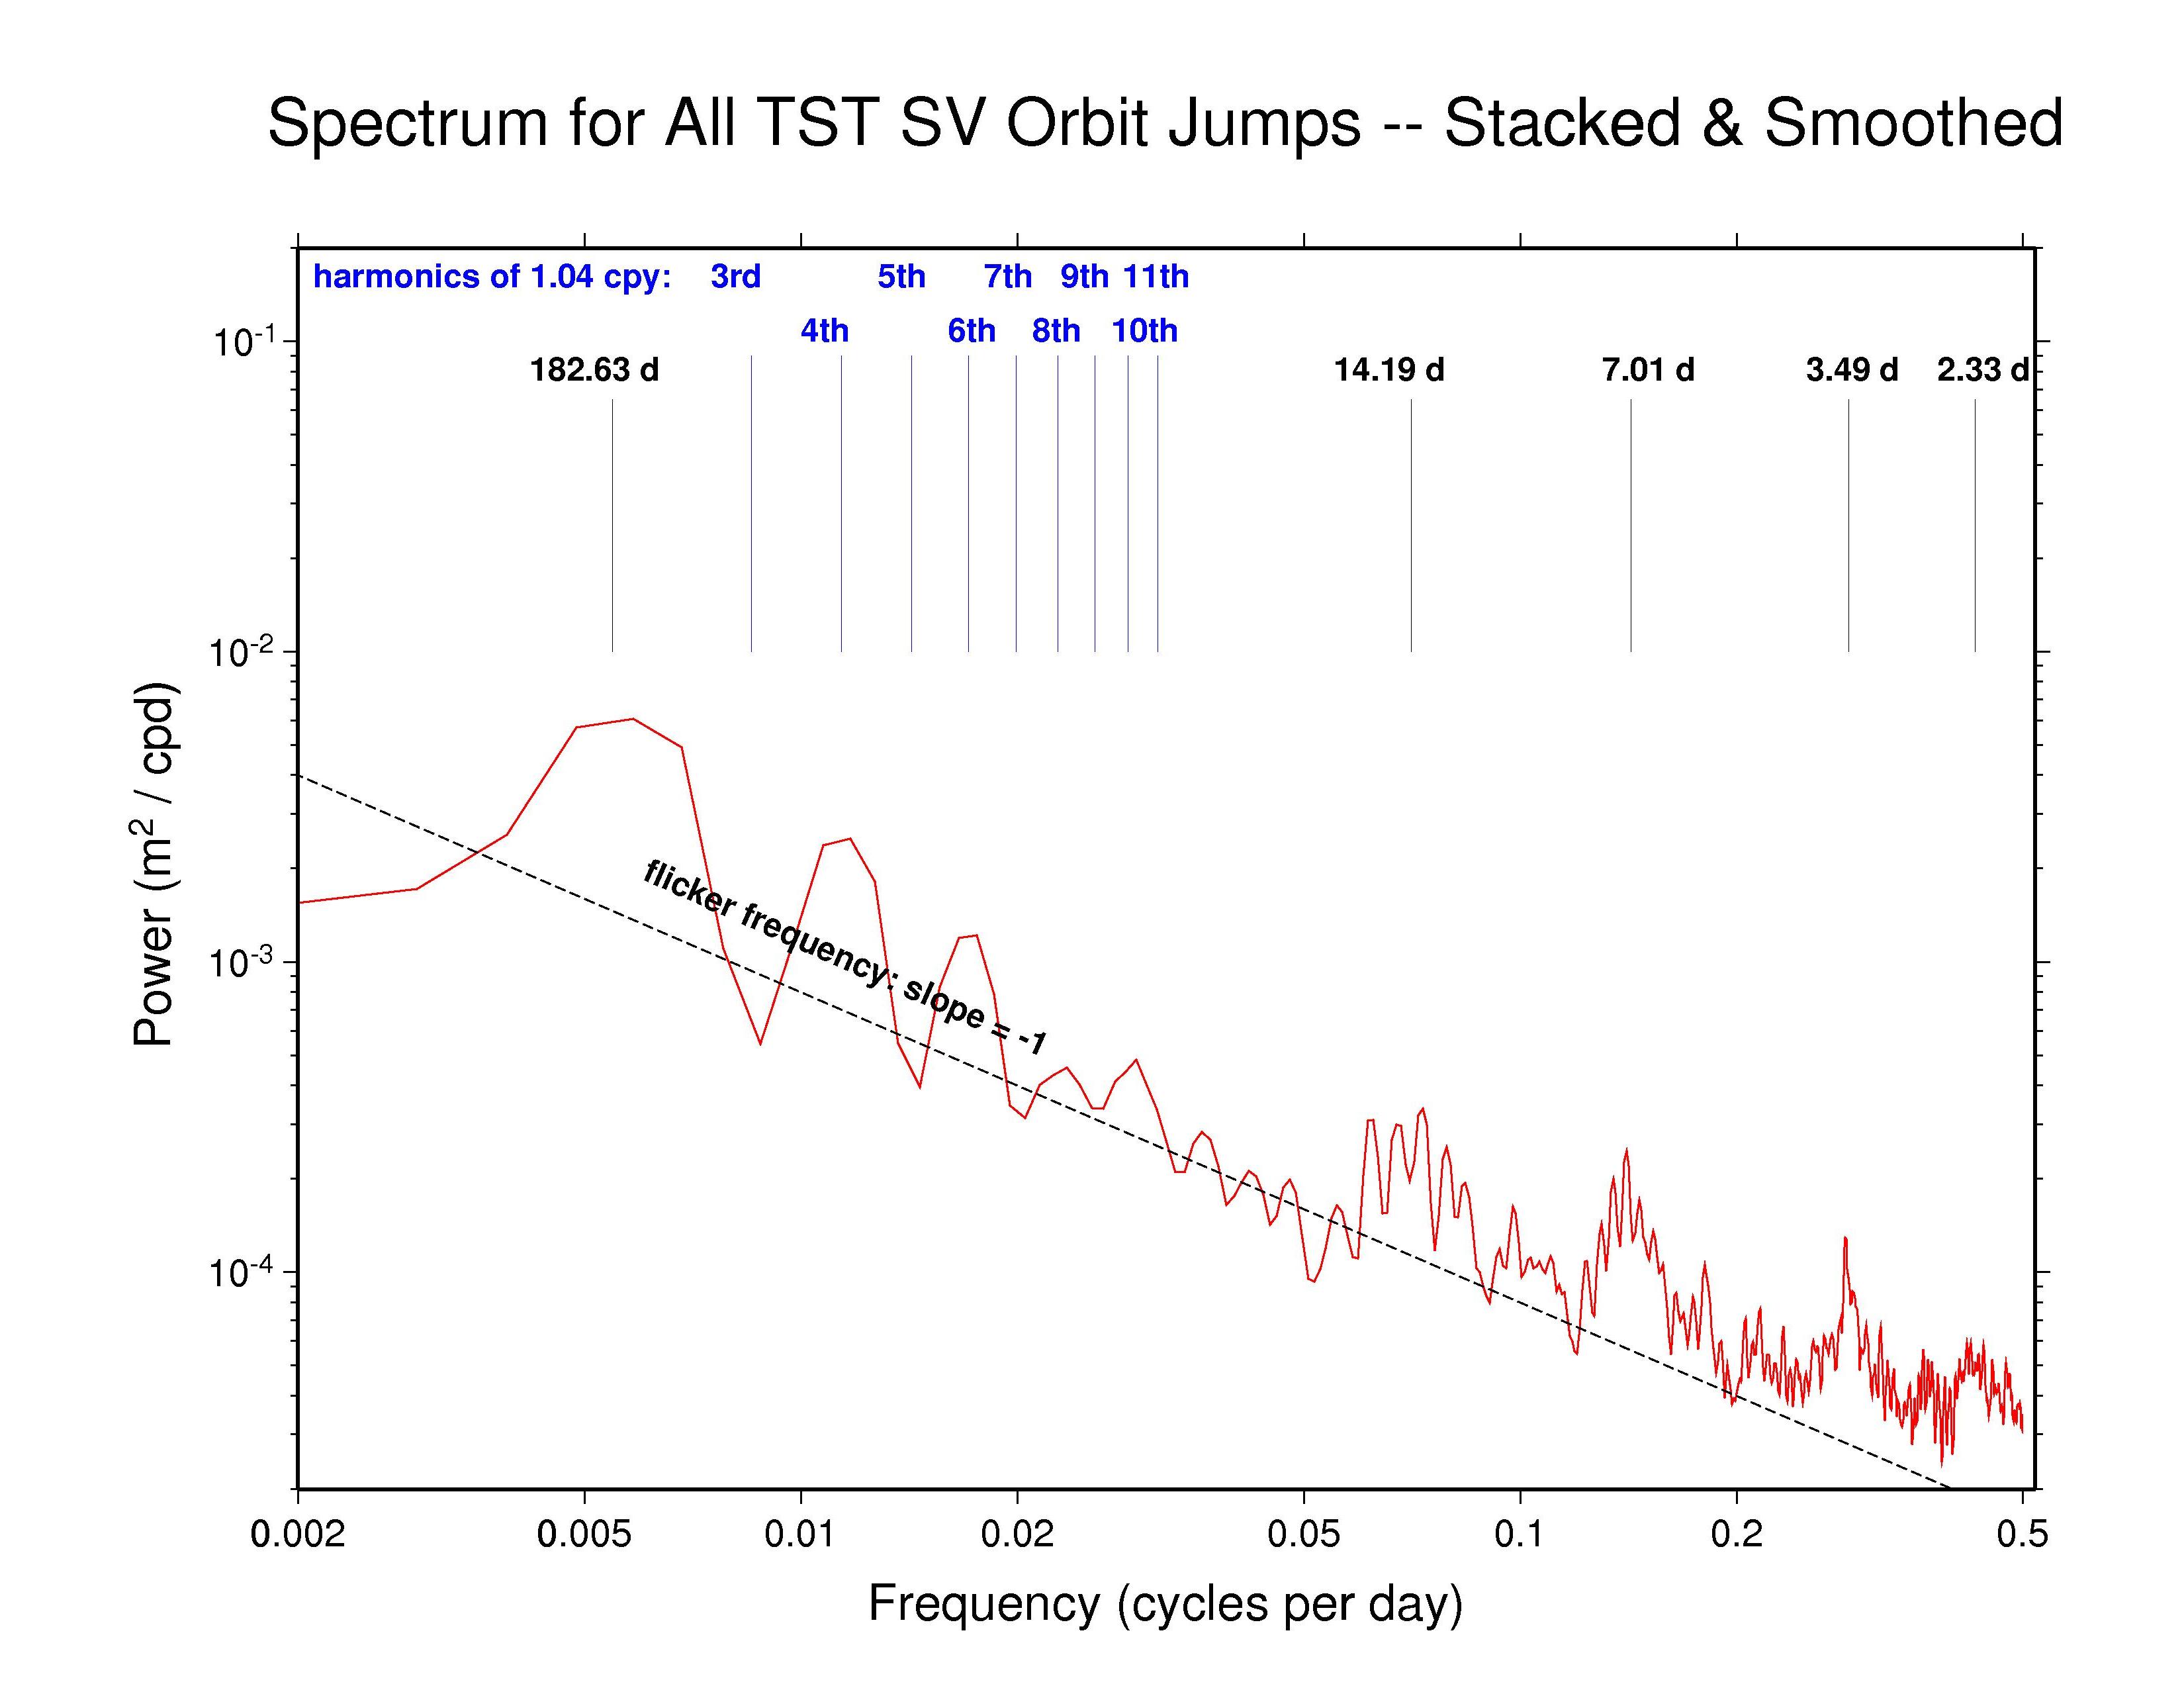
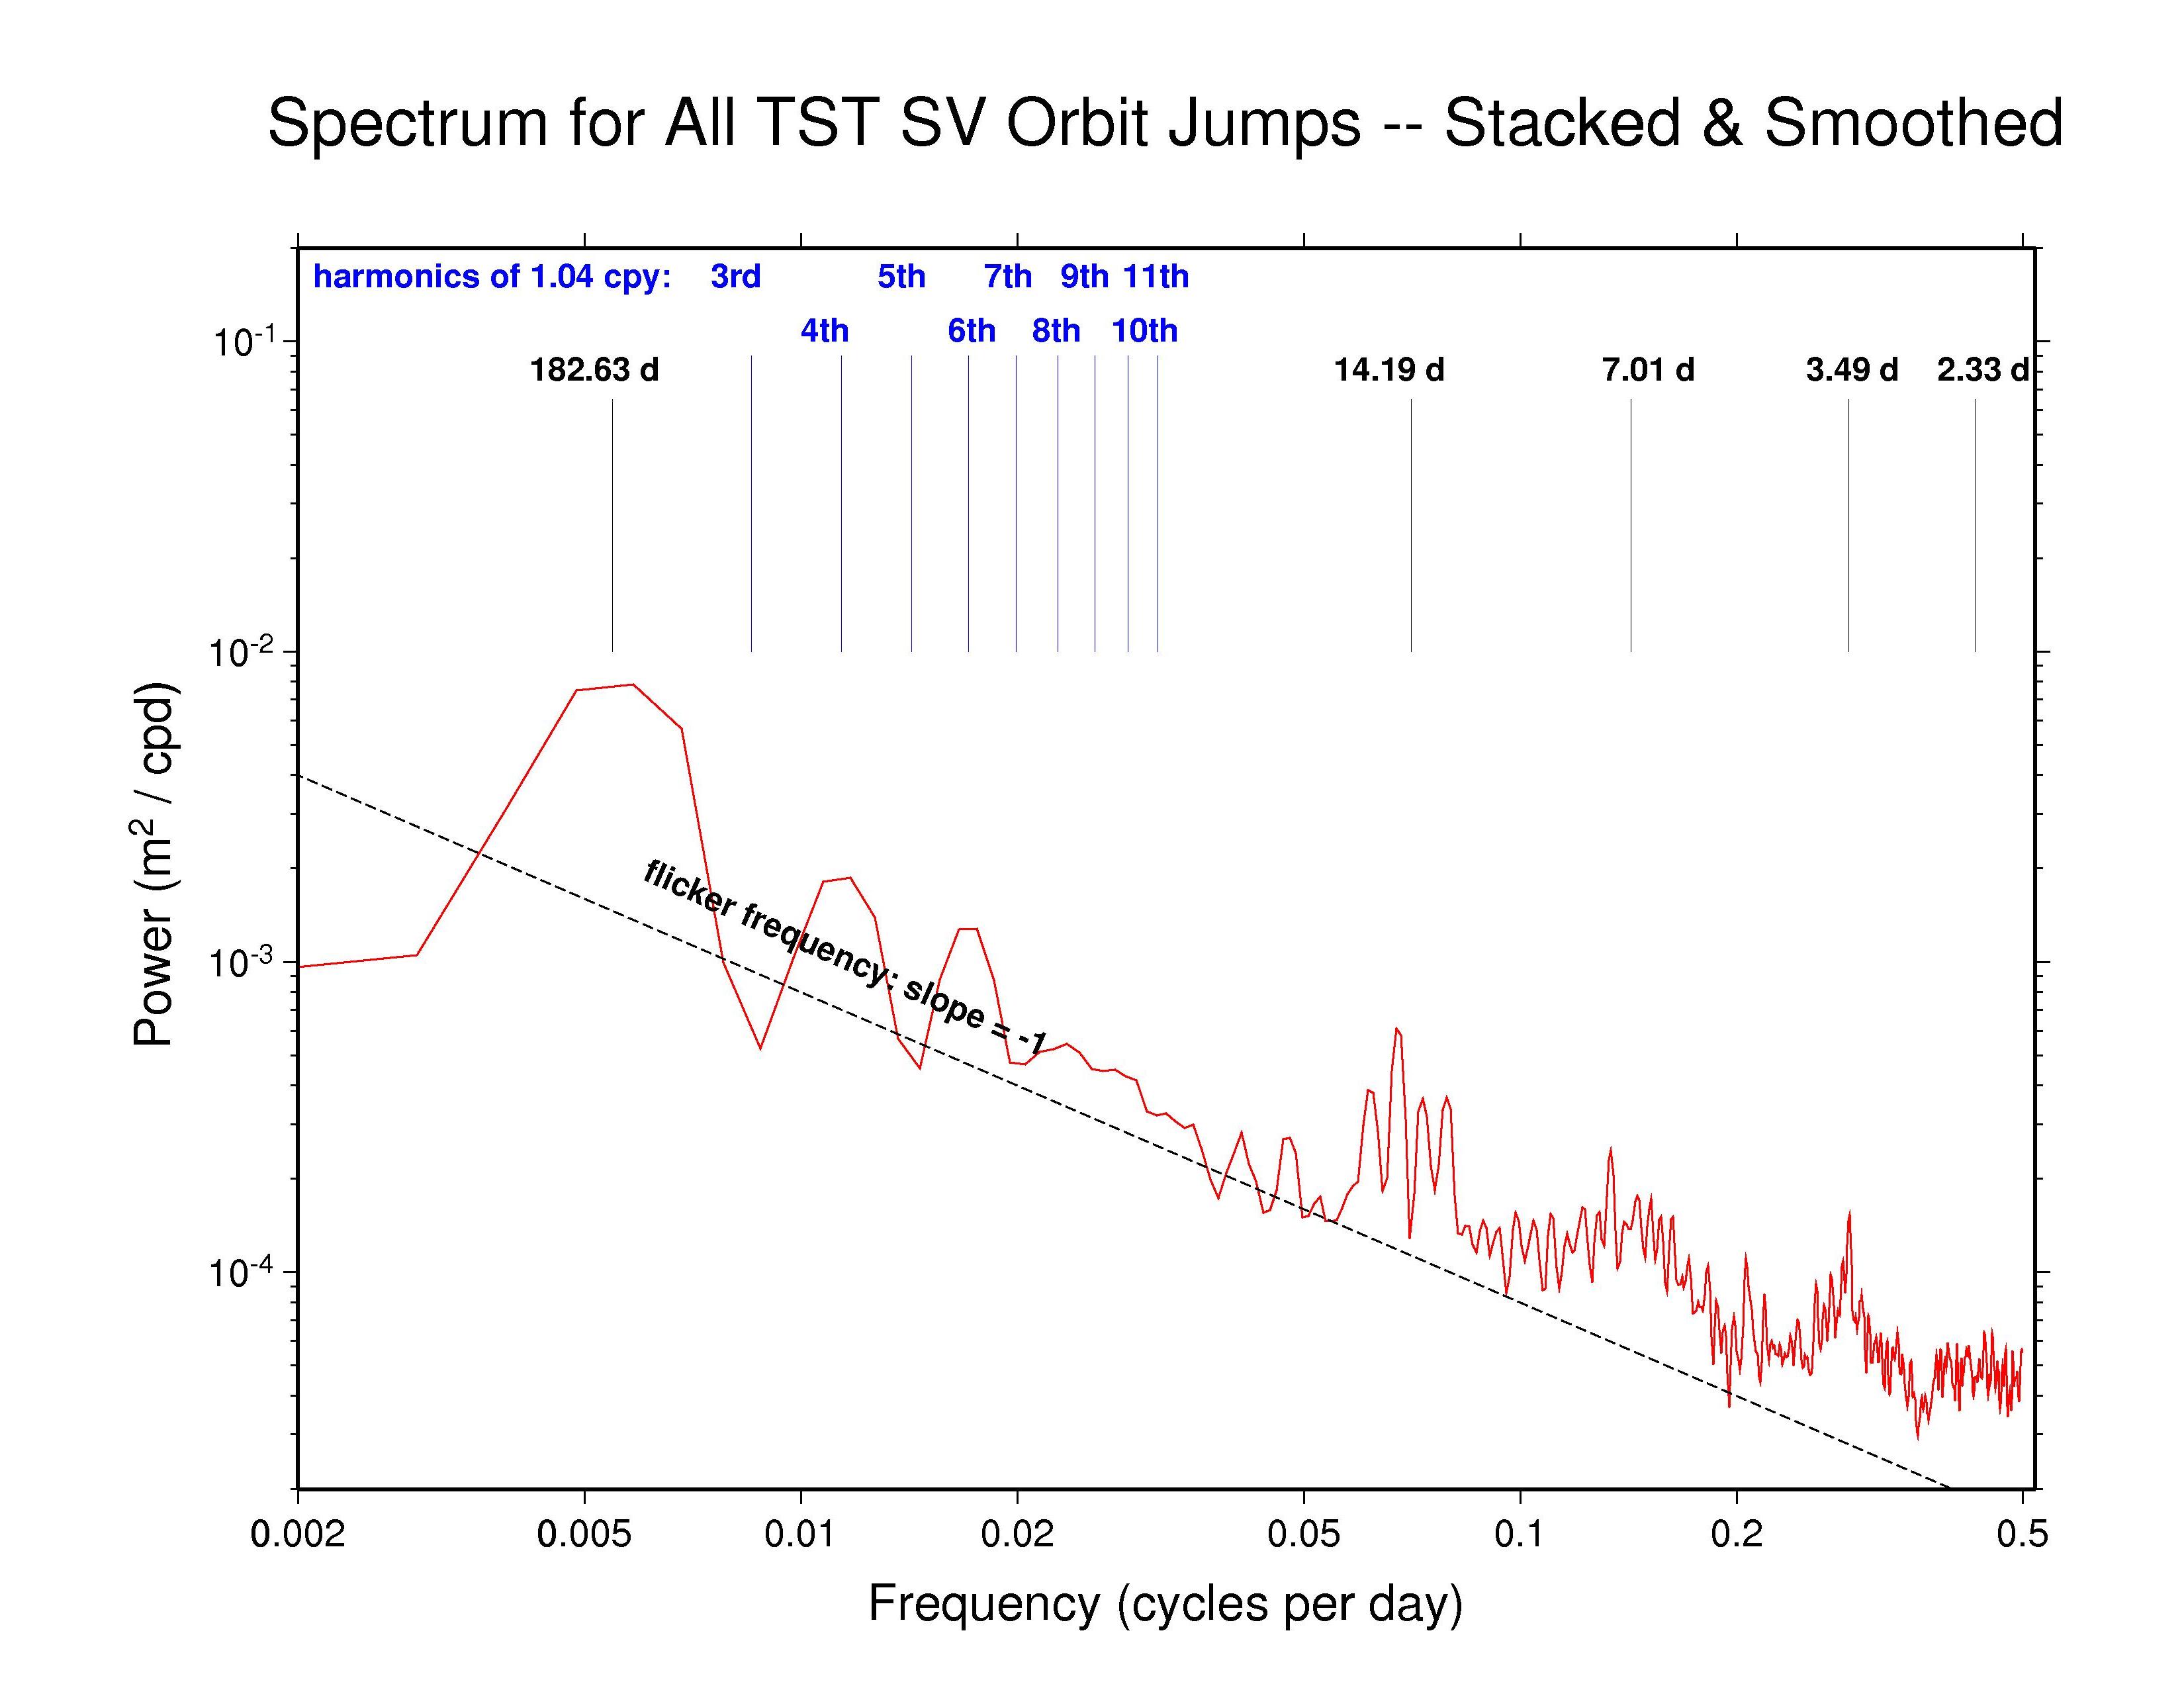
This website examines the performance of the GPS satellite orbits determined by each Analysis Center (AC) participating in the IGS Reprocessing Campaign #1. A companion site looks at the associated polar motion time series. Orbits for the 1025 days through week 1459 (end of 2007) have been used to obtain consistent, comparable, and modern results from all ACs. This span covers epochs from MJD 53439.5 through 54463.5, which corresponds to the period 10 Mar 2005 (week 1313_5) through 29 Dec 2007 (week 1459_6). In the cases where more than the usual 96 15-minute epochs are reported in the AC SP3 files, only those between 00:00 and 23:45 are used here.
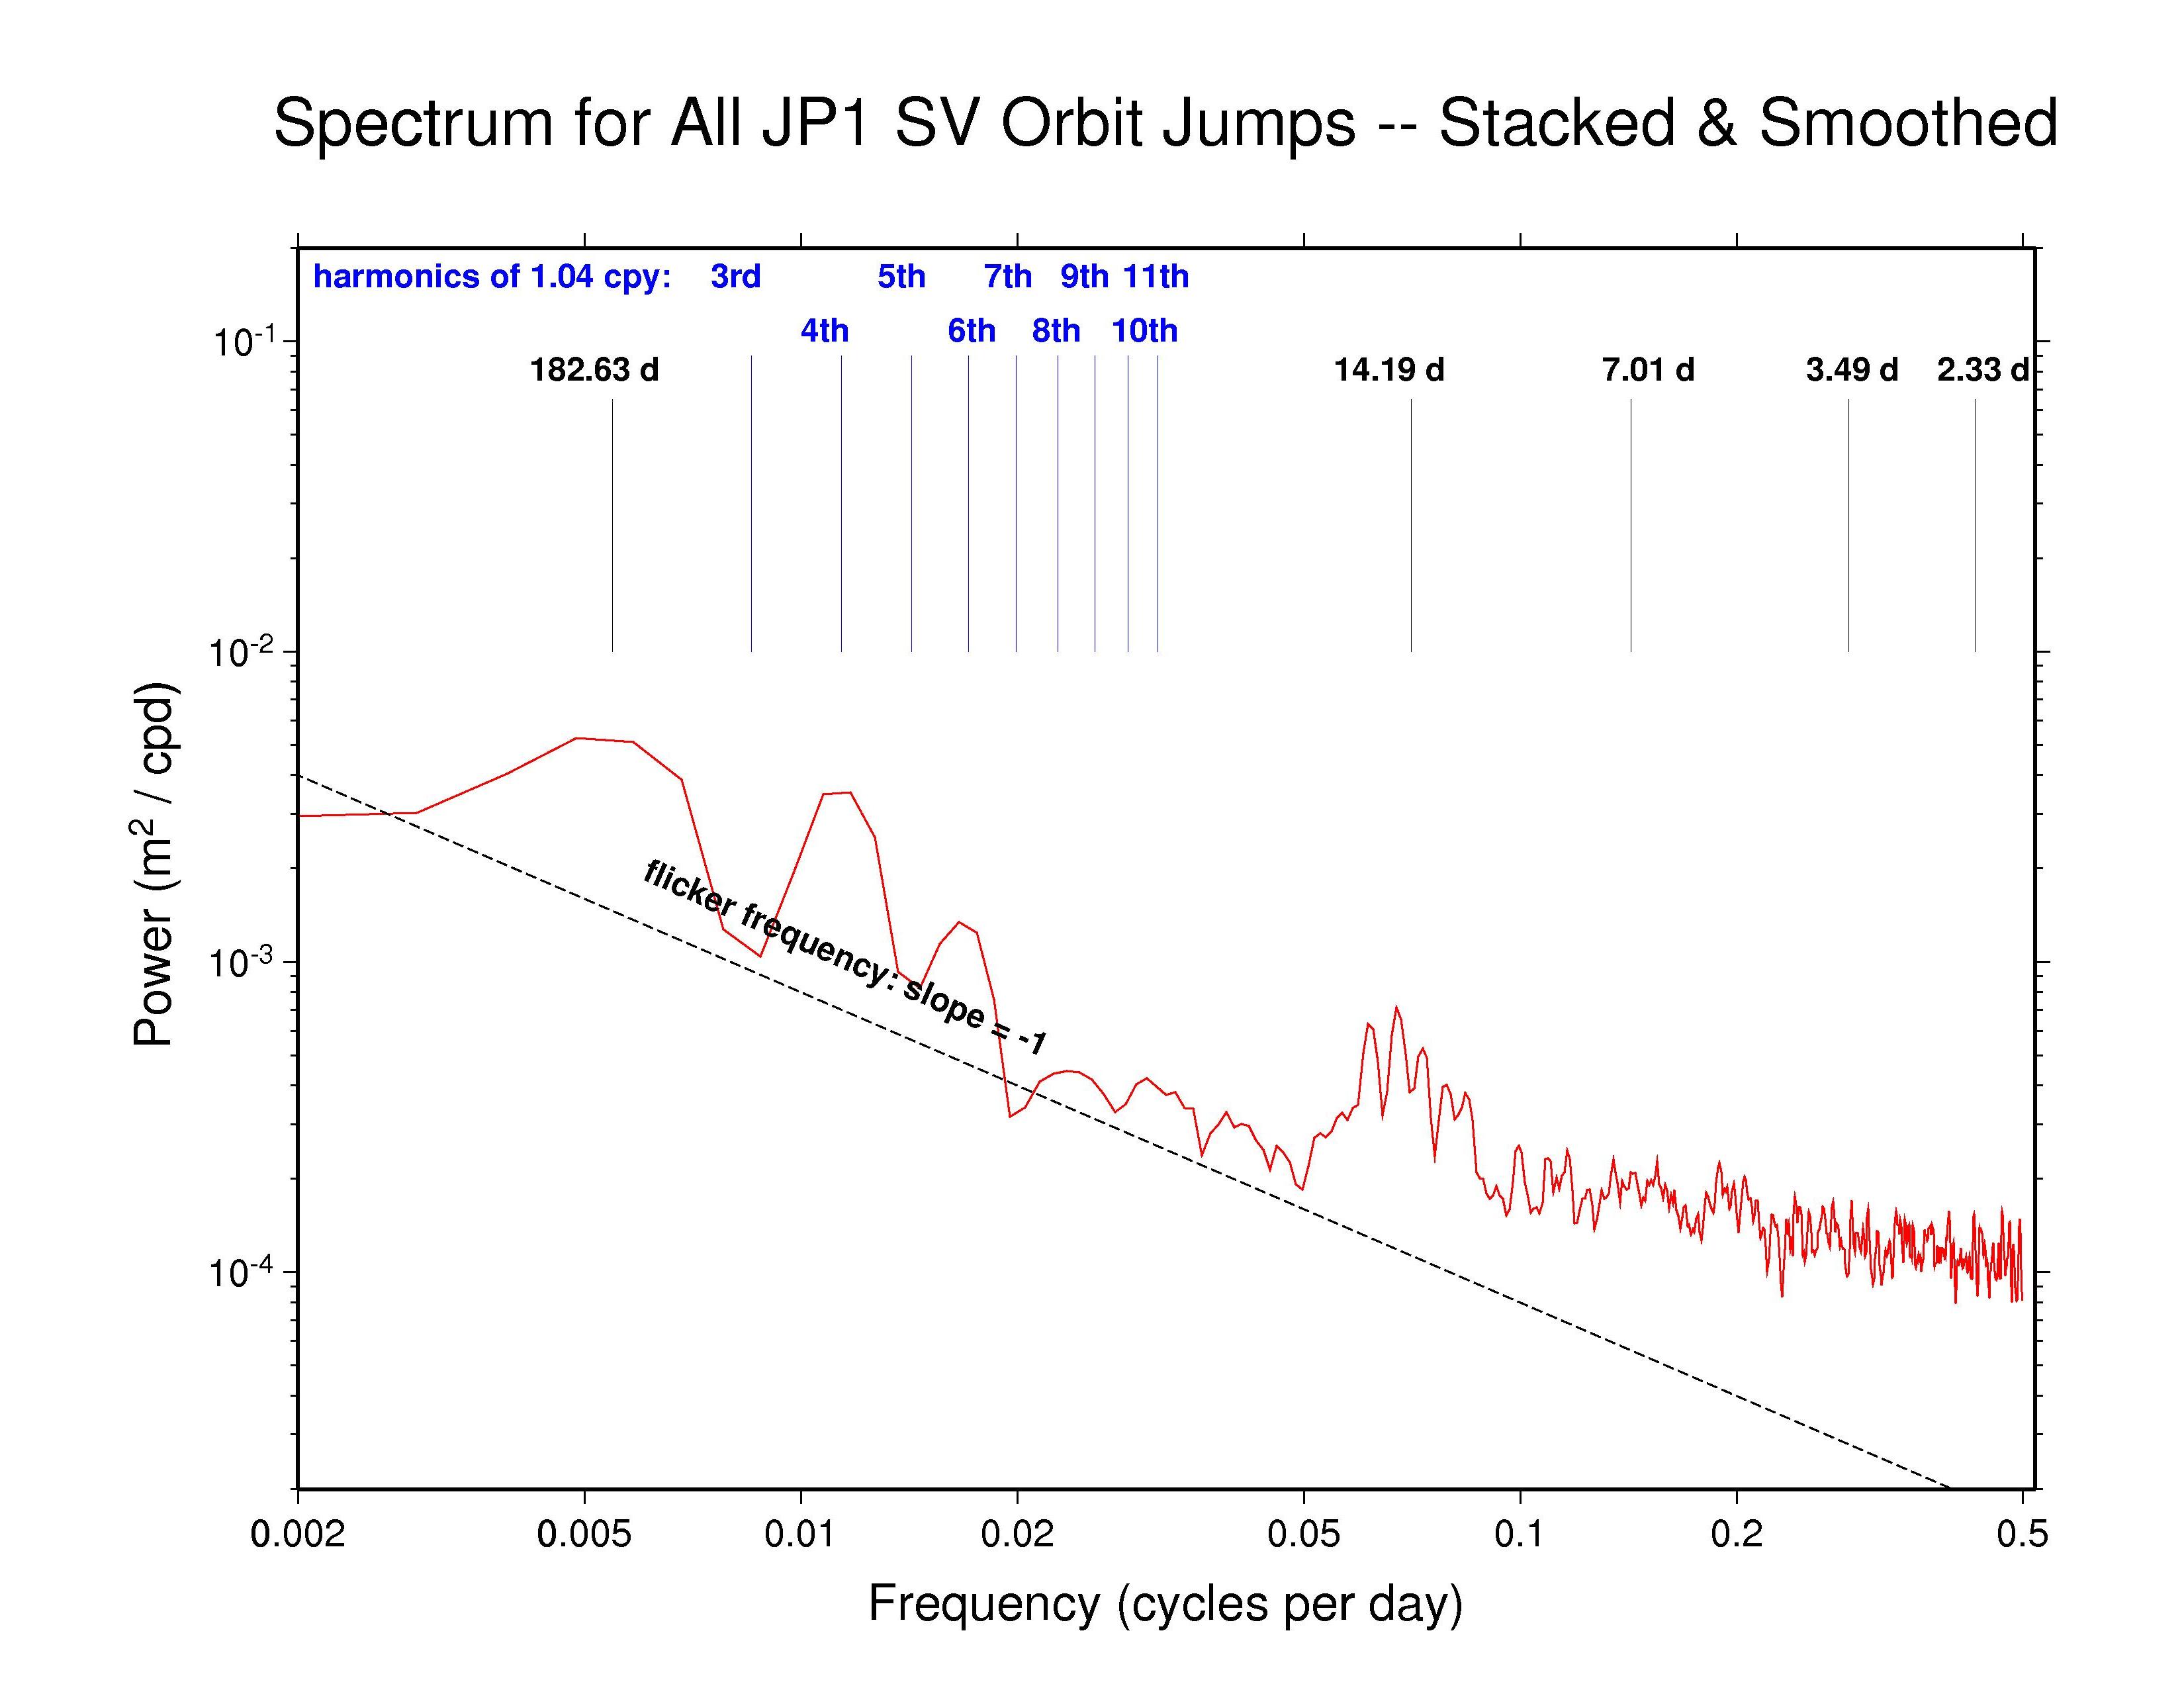
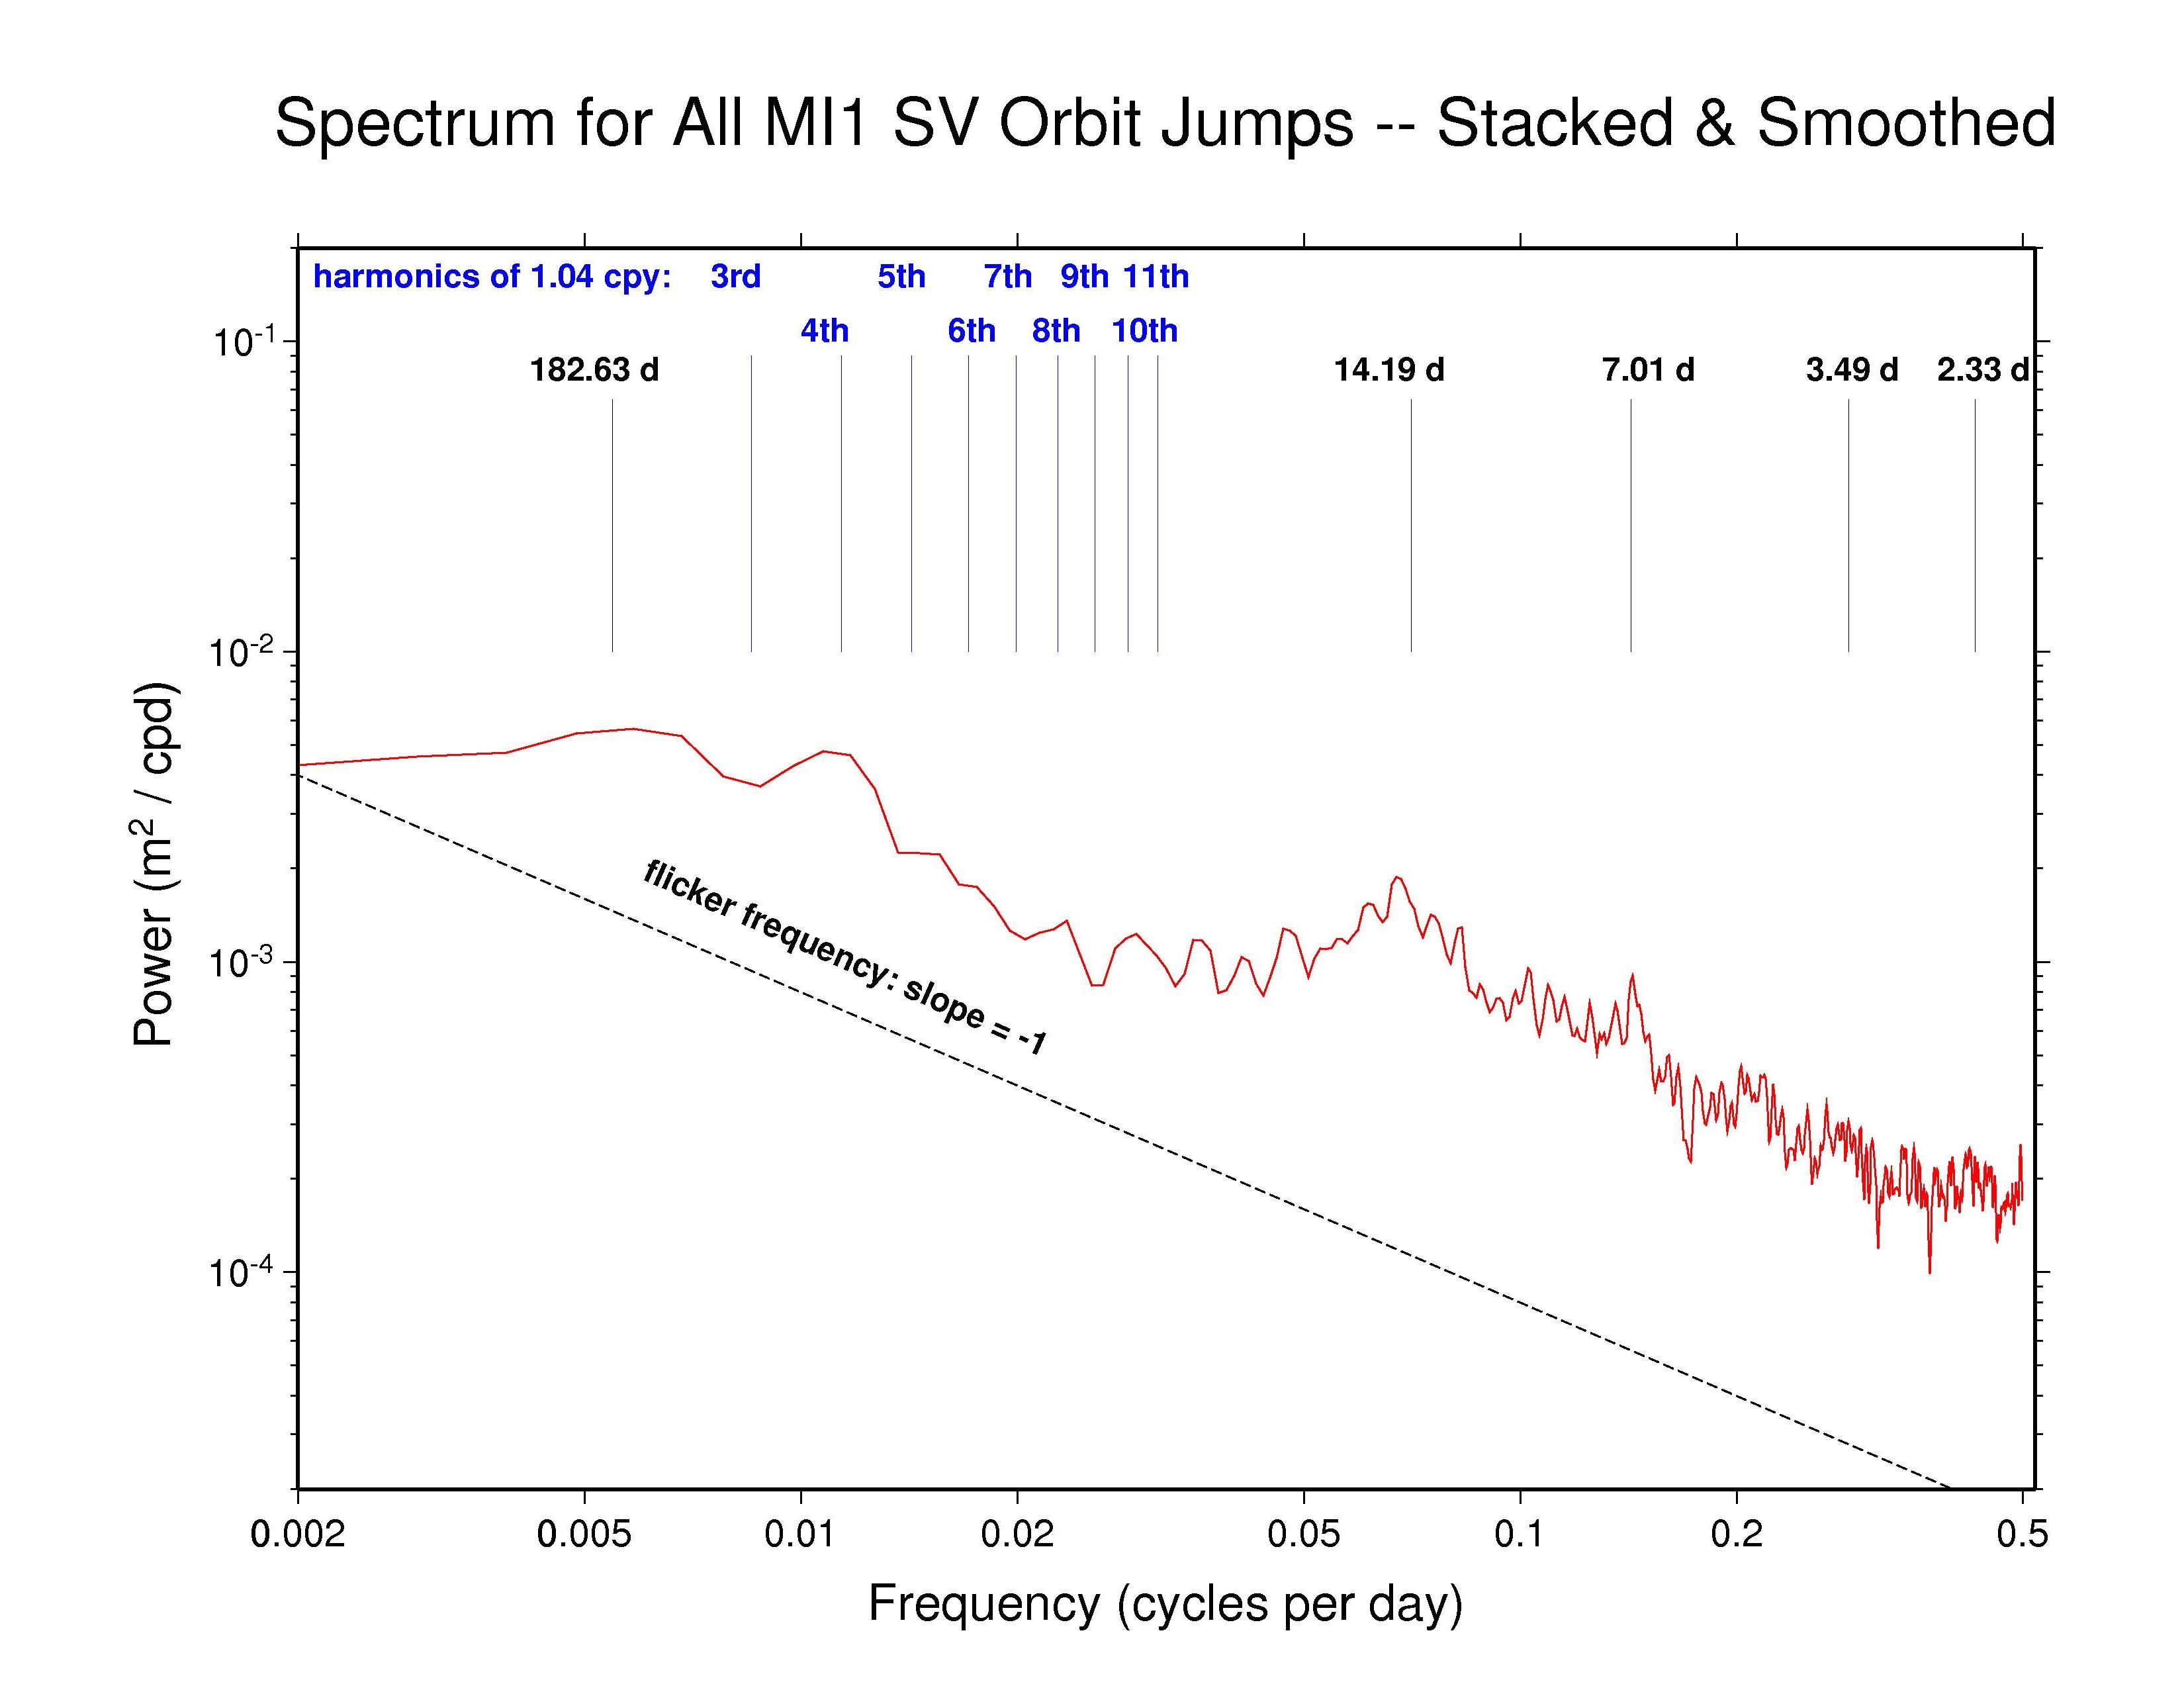
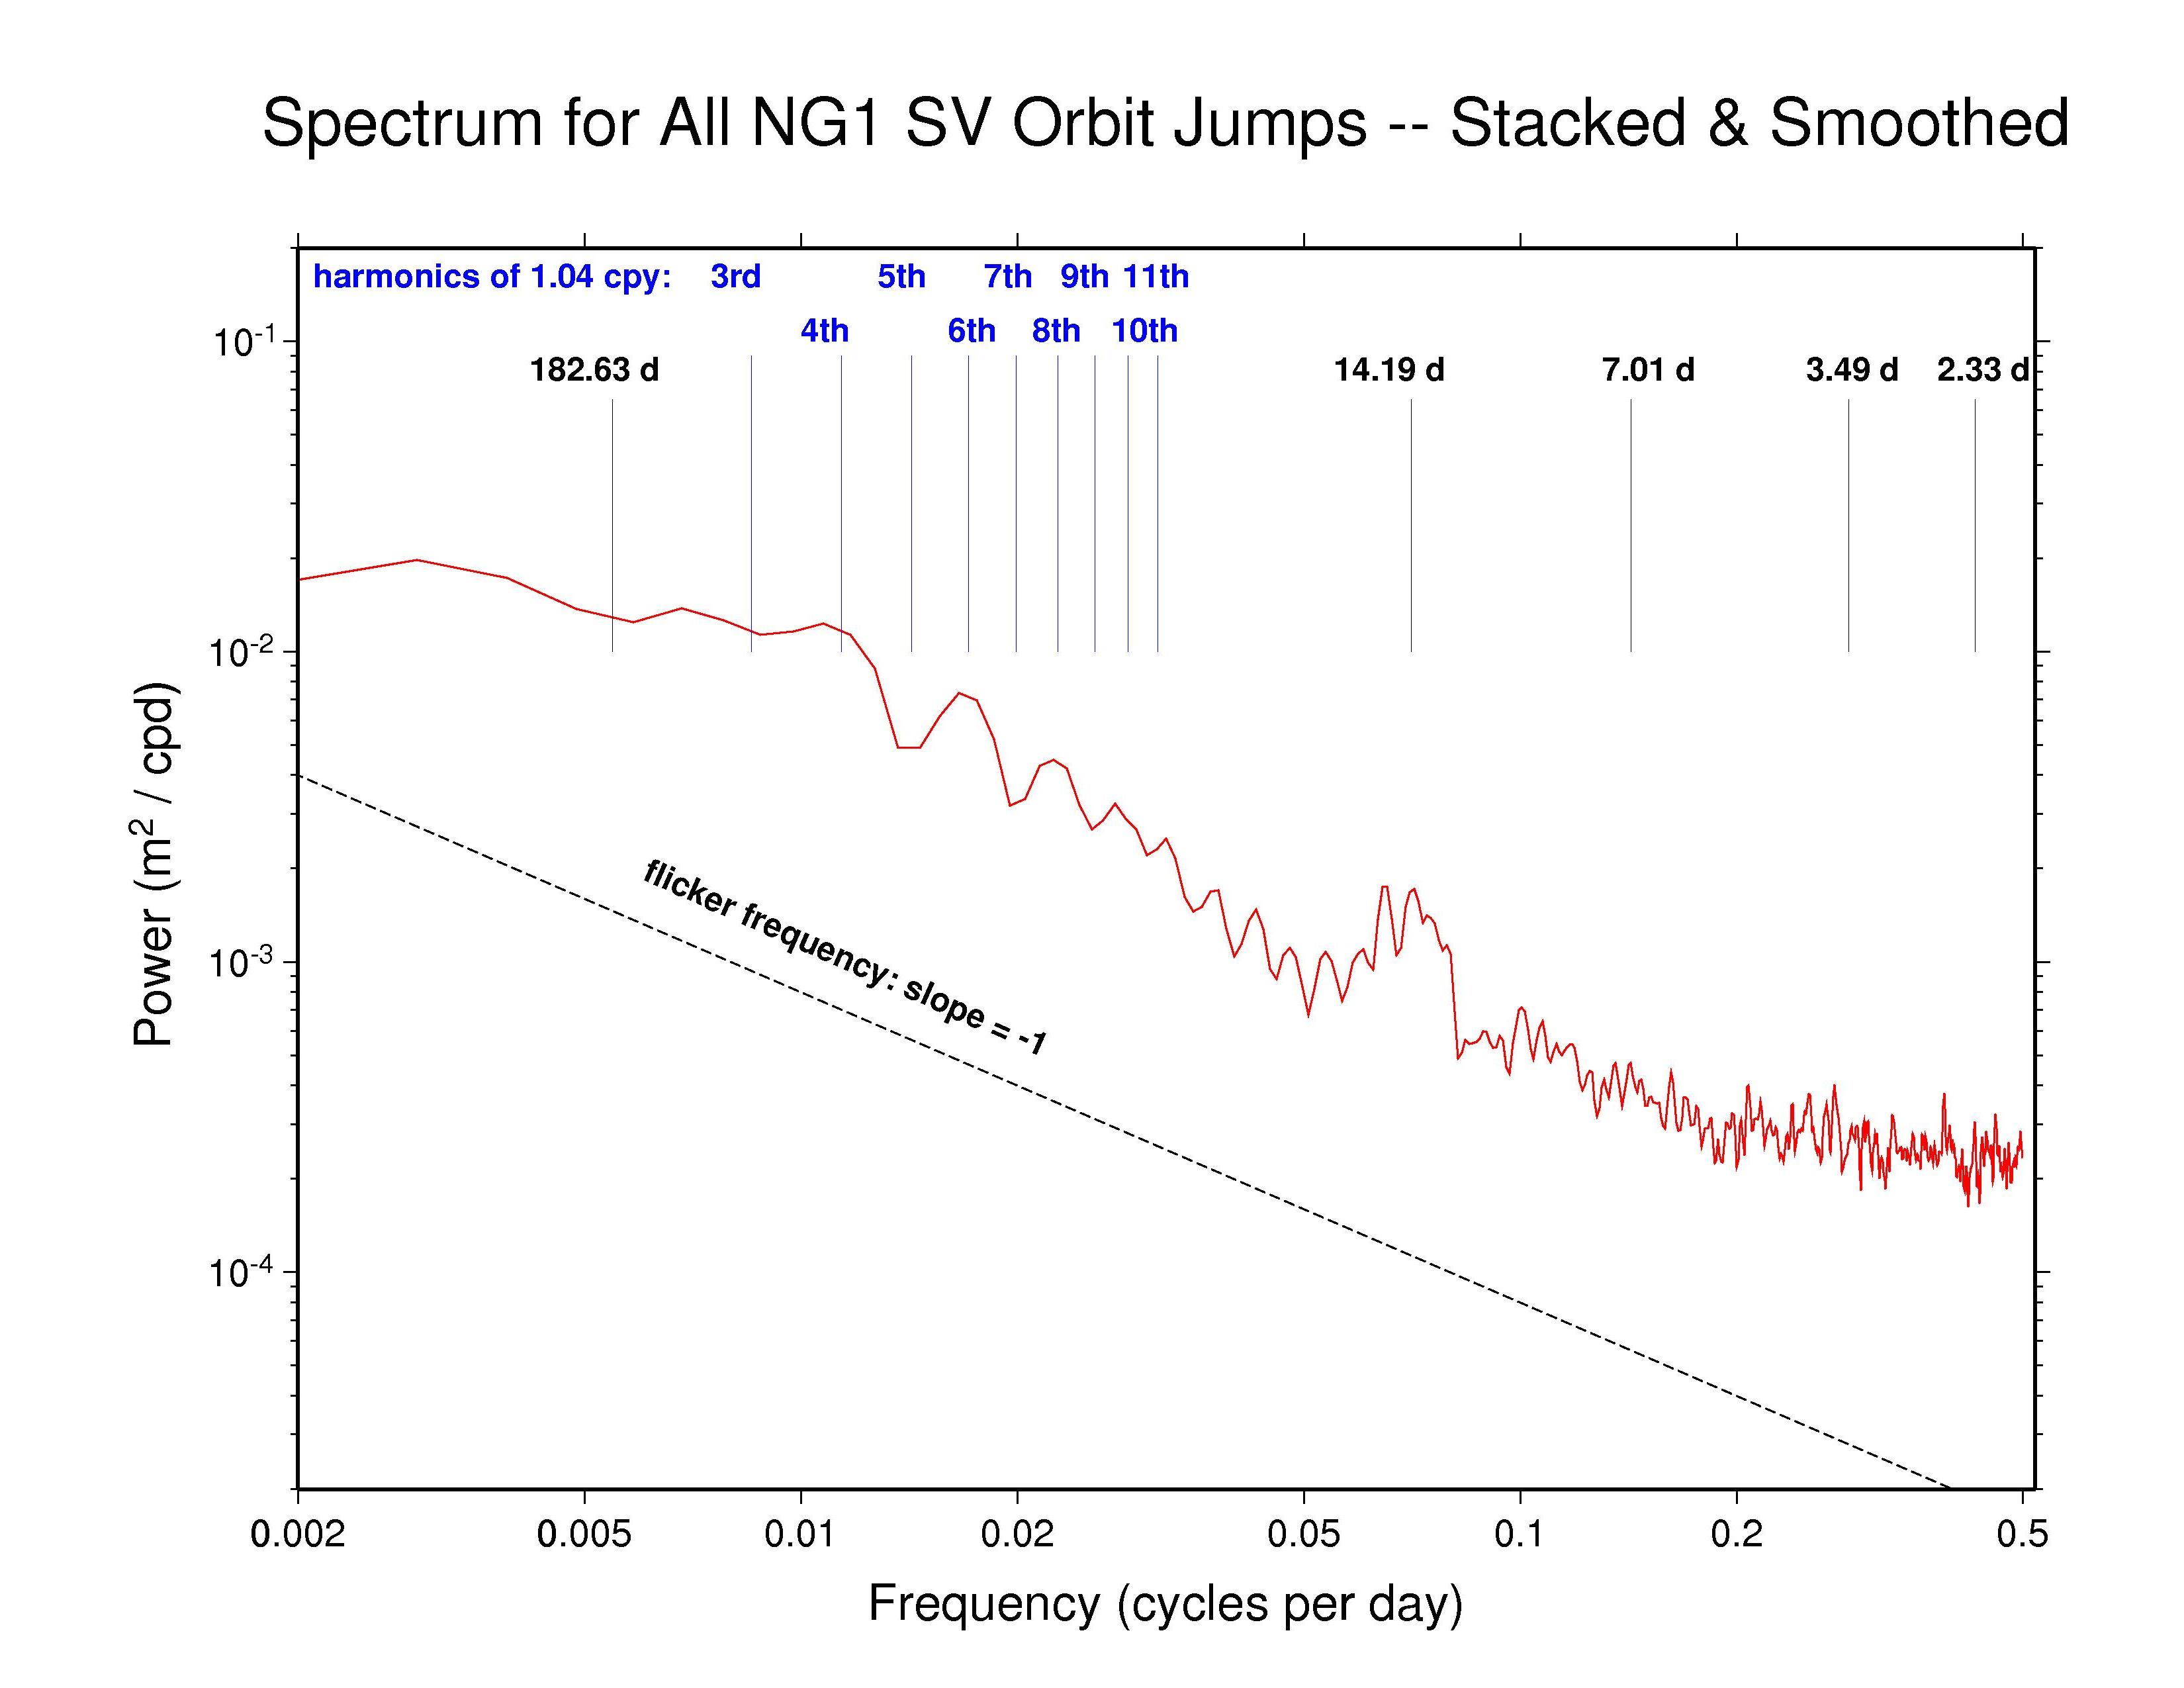
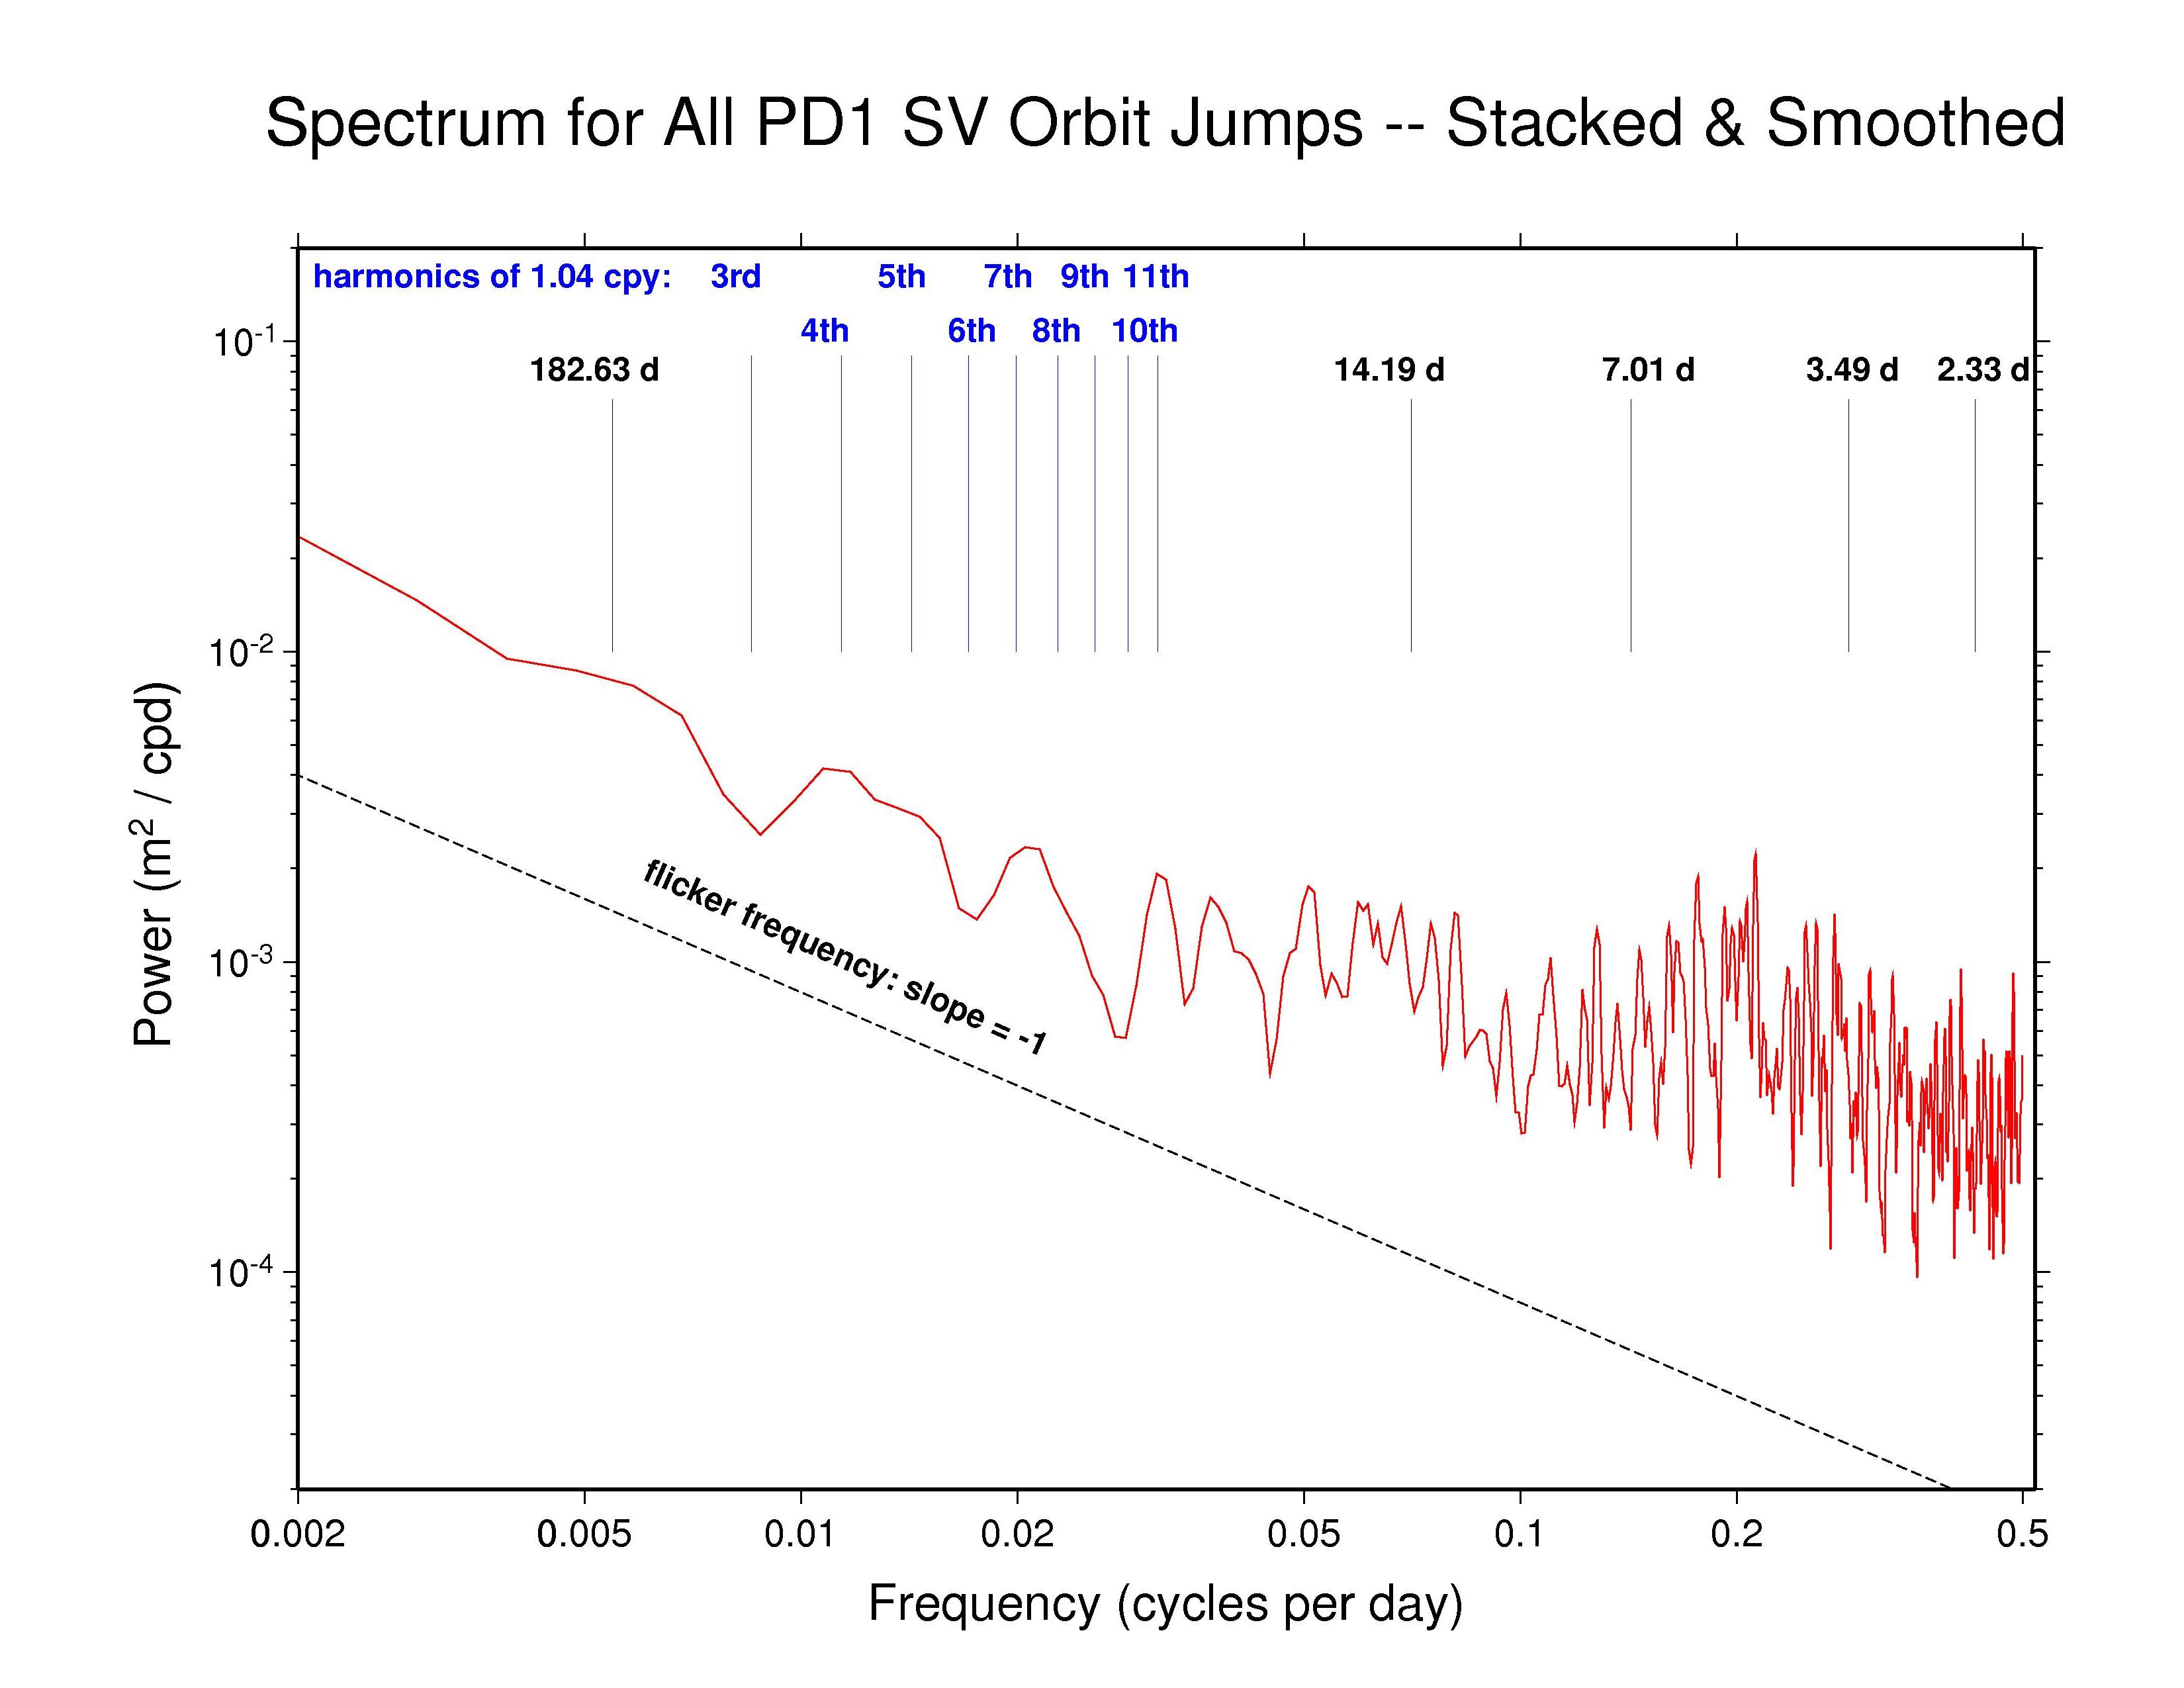
As there is no absolute knowledge of the true GPS orbits, we use a measure of satellite position repeatability to characterize each AC product set. Each daily AC satellite ephemeris for each pair of consecutive days has been treated as pseudo-observations in a fit to the extended CODE orbit model (three position and three velocity parameters plus nine nuisance solar radiation parameters), then extrapolated to the mid-point epoch between the days, and the geocentric satellite position differences computed to give time series of orbit repeatabilities for each satellite and AC. Occasional data gaps have been filled by linear interpolation, then FFT power spectra computed, and the spectra stacked over the full GPS constellation for each AC and lightly smoothed in frequency (using a sliding boxcar over each three adjacent frequencies). Results are shown in the plots below.
In an earlier application of this method to operational IGS combined GPS orbits, Griffiths and Ray (2009) found the error introduced by the fitting and extrapolation process to range between 0 and 8 mm (mean = 3 mm) per geocentric component with 3D differences of 3 to 10 mm (mean = 6 mm). So, the effect of the orbit fitting-extrapolation process nearly always adds insignificant noise to these day-boundary orbit comparisons. That conclusion is also evident in the obvious diversity of results among AC orbits found here.
Most continuous geophysical processes and most physical noise processes
possess power spectra that decrease as the frequency raised to some
characteristic negative power ("spectral index"). The spectra are usually
"reddish" in the sense of having more power at the lower frequencies
(i.e., longer periods). For reference, a power law with spectral index
of -1 is drawn on each plot (not a fit). This corresponds to the
behavior of a flicker phase noise process. White noise has a flat
power spectrum independent of frequency and probably explains the
asymptotic high-frequency flattening apparent in most AC spectra.
Several interesting spectral lines are also indicated in each plot
below.
  CODE —
ps file CODE —
ps file
|
 EMR —
ps file EMR —
ps file
|
 ESA —
ps file ESA —
ps file
|
 GFZ —
ps file GFZ —
ps file
|
 JPL —
ps file JPL —
ps file
|
 MIT —
ps file MIT —
ps file
|
 NGS —
ps file NGS —
ps file
|
 PDR —
ps file PDR —
ps file
|
 SIO —
ps file SIO —
ps file
|
 ULR —
ps file ULR —
ps file
|
Our analysis reveals highly varied AC orbit behaviors. But most AC spectra generally follow a flicker phase power-law trend (slope -1) from the longest down to about monthly periods. This characteristic of the IGS orbits probably has much to do with the long-appreciated temporal correlations in GPS station position time series (e.g., Williams et al., J. Geophys. Res., 109(B03412), doi: 10.1029/2003JB002741, 2004). Several spectra show superposed broadly distributed semi-annual power, which is probably related mostly to satellite eclipse seasons, while diffuse fortnightly bands are also common to most ACs. The latter could possibly be linked to a range of tidal modeling or perhaps nutation errors. In addition, we have marked several harmonics of the GPS draconitic year (1.040 cpy), of which the even multiples appear to be present with varying amplitudes in most spectra. For a summary of the AC spectral features, see the table at bottom below.
Recall that the point of comparison between the successive daily orbital arcs is at the fixed epoch 23:52:30 (GPS time), 7.5 minutes after the end of one SP3 file and 7.5 minutes before the next. As the orbit differences advance in 1-day steps, this comparison point moves around the GPS ellipse about 1 degree per day. A full circuit is completed in the 351.4 d of the GPS draconitic year due to the slow precession of the orbit plane because of the Earth's oblateness. During this time, two eclipse seasons are encountered for each GPS orbit plane. It is the beating of these two cycles that probably explains the appearance of the even 1.040 cpy harmonics in nearly all the spectra.
High-frequency white noise floors can be detected in most AC orbit spectra, with a minimum asymptotic sigma of about 10.5 mm for JPL. ESA and MIT have slightly higher high-frequency scatters of about 14 mm while the remaining ACs are somewhat higher still. However, the orbit discontinuity scatters for JPL are probably not fully comparable to most other ACs because JPL uses overlapping 30-hr processing arcs (3 hr of extra data at each end of the day). This practice introduces correlations between the orbits of successive days and attenuates the orbit discontinuities by an unknown amount. A similar but greater attenuating effect is expected for CODE and PDR since they report the mid-day values for each sliding 3-day processing arc (with constrained velocity breaks introduced every 12 hr). The observed orbit discontinuities for CODE are as expected. But unexpectedly, the high-frequency character of the PDR orbit discontinuities is more erratic than for nearly all other ACs, rather than being smoother. The remaining ACs (except GFZ, see below) use strictly 24 hr of data for each daily orbit. (Note, though, that even with daily independent orbit arcs, some level of correlation between days is expected due to the weekly stacking of the station coordinates used by the IGS.)
The orbit discontinuity spectrum for GFZ is unique. Tidal features are not seen, but in addition to the even harmonics of 1.040 cpy, there are harmonics of a weekly frequency (0.1429 cpy) up to at least the third multiple. The weekly harmonics each seem to be split into dense spectral combs by some unknown modulation. To check whether this behavior could be an artifact of the fit-and-extrapolate method we have used here to compute the day-boundary discontinuities, two tests have been performed. In the first (left plot below), the GFZ orbits have been fit using the same extended CODE model and the result of the fit at 00:00 is compared to the originally reported values (no extrapolation involved). The plot shows the associated power spectrum for those differences. In the second test (right plot below), the same fit is made but omitting values for the 23:45 epoch, then the fit is extrapolated and compared to the originally reported value at 23:45. The associated power spectrum for those differences is shown.
While similar features are seen in the test spectra as in the
previous GFZ discontinuity plot, the power is much lower. So we do
not believe that the GFZ result is an artifact. Instead it seems
likelier that the GFZ orbits contain signal components that are not
well fitted by the extended CODE model, which show up also in the tests.
But the presumed non-once-per-revolution GFZ signals also contribute
even more to the orbit discontinuities. This is especially difficult
to understand for GFZ because their reported repro1 SP3 files span periods
longer than 24 hours suggesting that some implicit smoothing has
been enforced in their data processing (if the extra epochs are not
merely extrapolations but use observational data).
 orbit fit error spectrum —
ps file orbit fit error spectrum —
ps file
|
 orbit fit & extrapolation error spectrum —
ps file orbit fit & extrapolation error spectrum —
ps file
|
A possible explanation for the weekly harmonics in the GFZ orbit discontinuities can be found by inspecting the spectrum of the day-boundary discontinuities for their reported UT1S/LODS values. See this companion site for details and explanations; the UT1S/LODS discontinuity spectra for GFZ and PDR are reproduced below. UT1S/LODS day-boundary discontinuities are much more difficult to interpret than corresponding polar motion discontinuities. Because the polar motion offsets and rates are both estimated freely and in a fully self-consistent way, their discontinuities afford insights into the data modeling and processing. The same is not true for UT1/LOD because UT1 is not observable by satellite methods due to direct correlation with the orbit node parameters that must also be estimated simultaneously. Some constraint must be applied to fix UT1 at some epoch and variations in UT1 (equivalent to LOD) determined at other epochs relative to the fixed epoch. Nevertheless, the UT1S/LODS discontinuities can provide some insight into the UT1 fixation process used by the ACs.
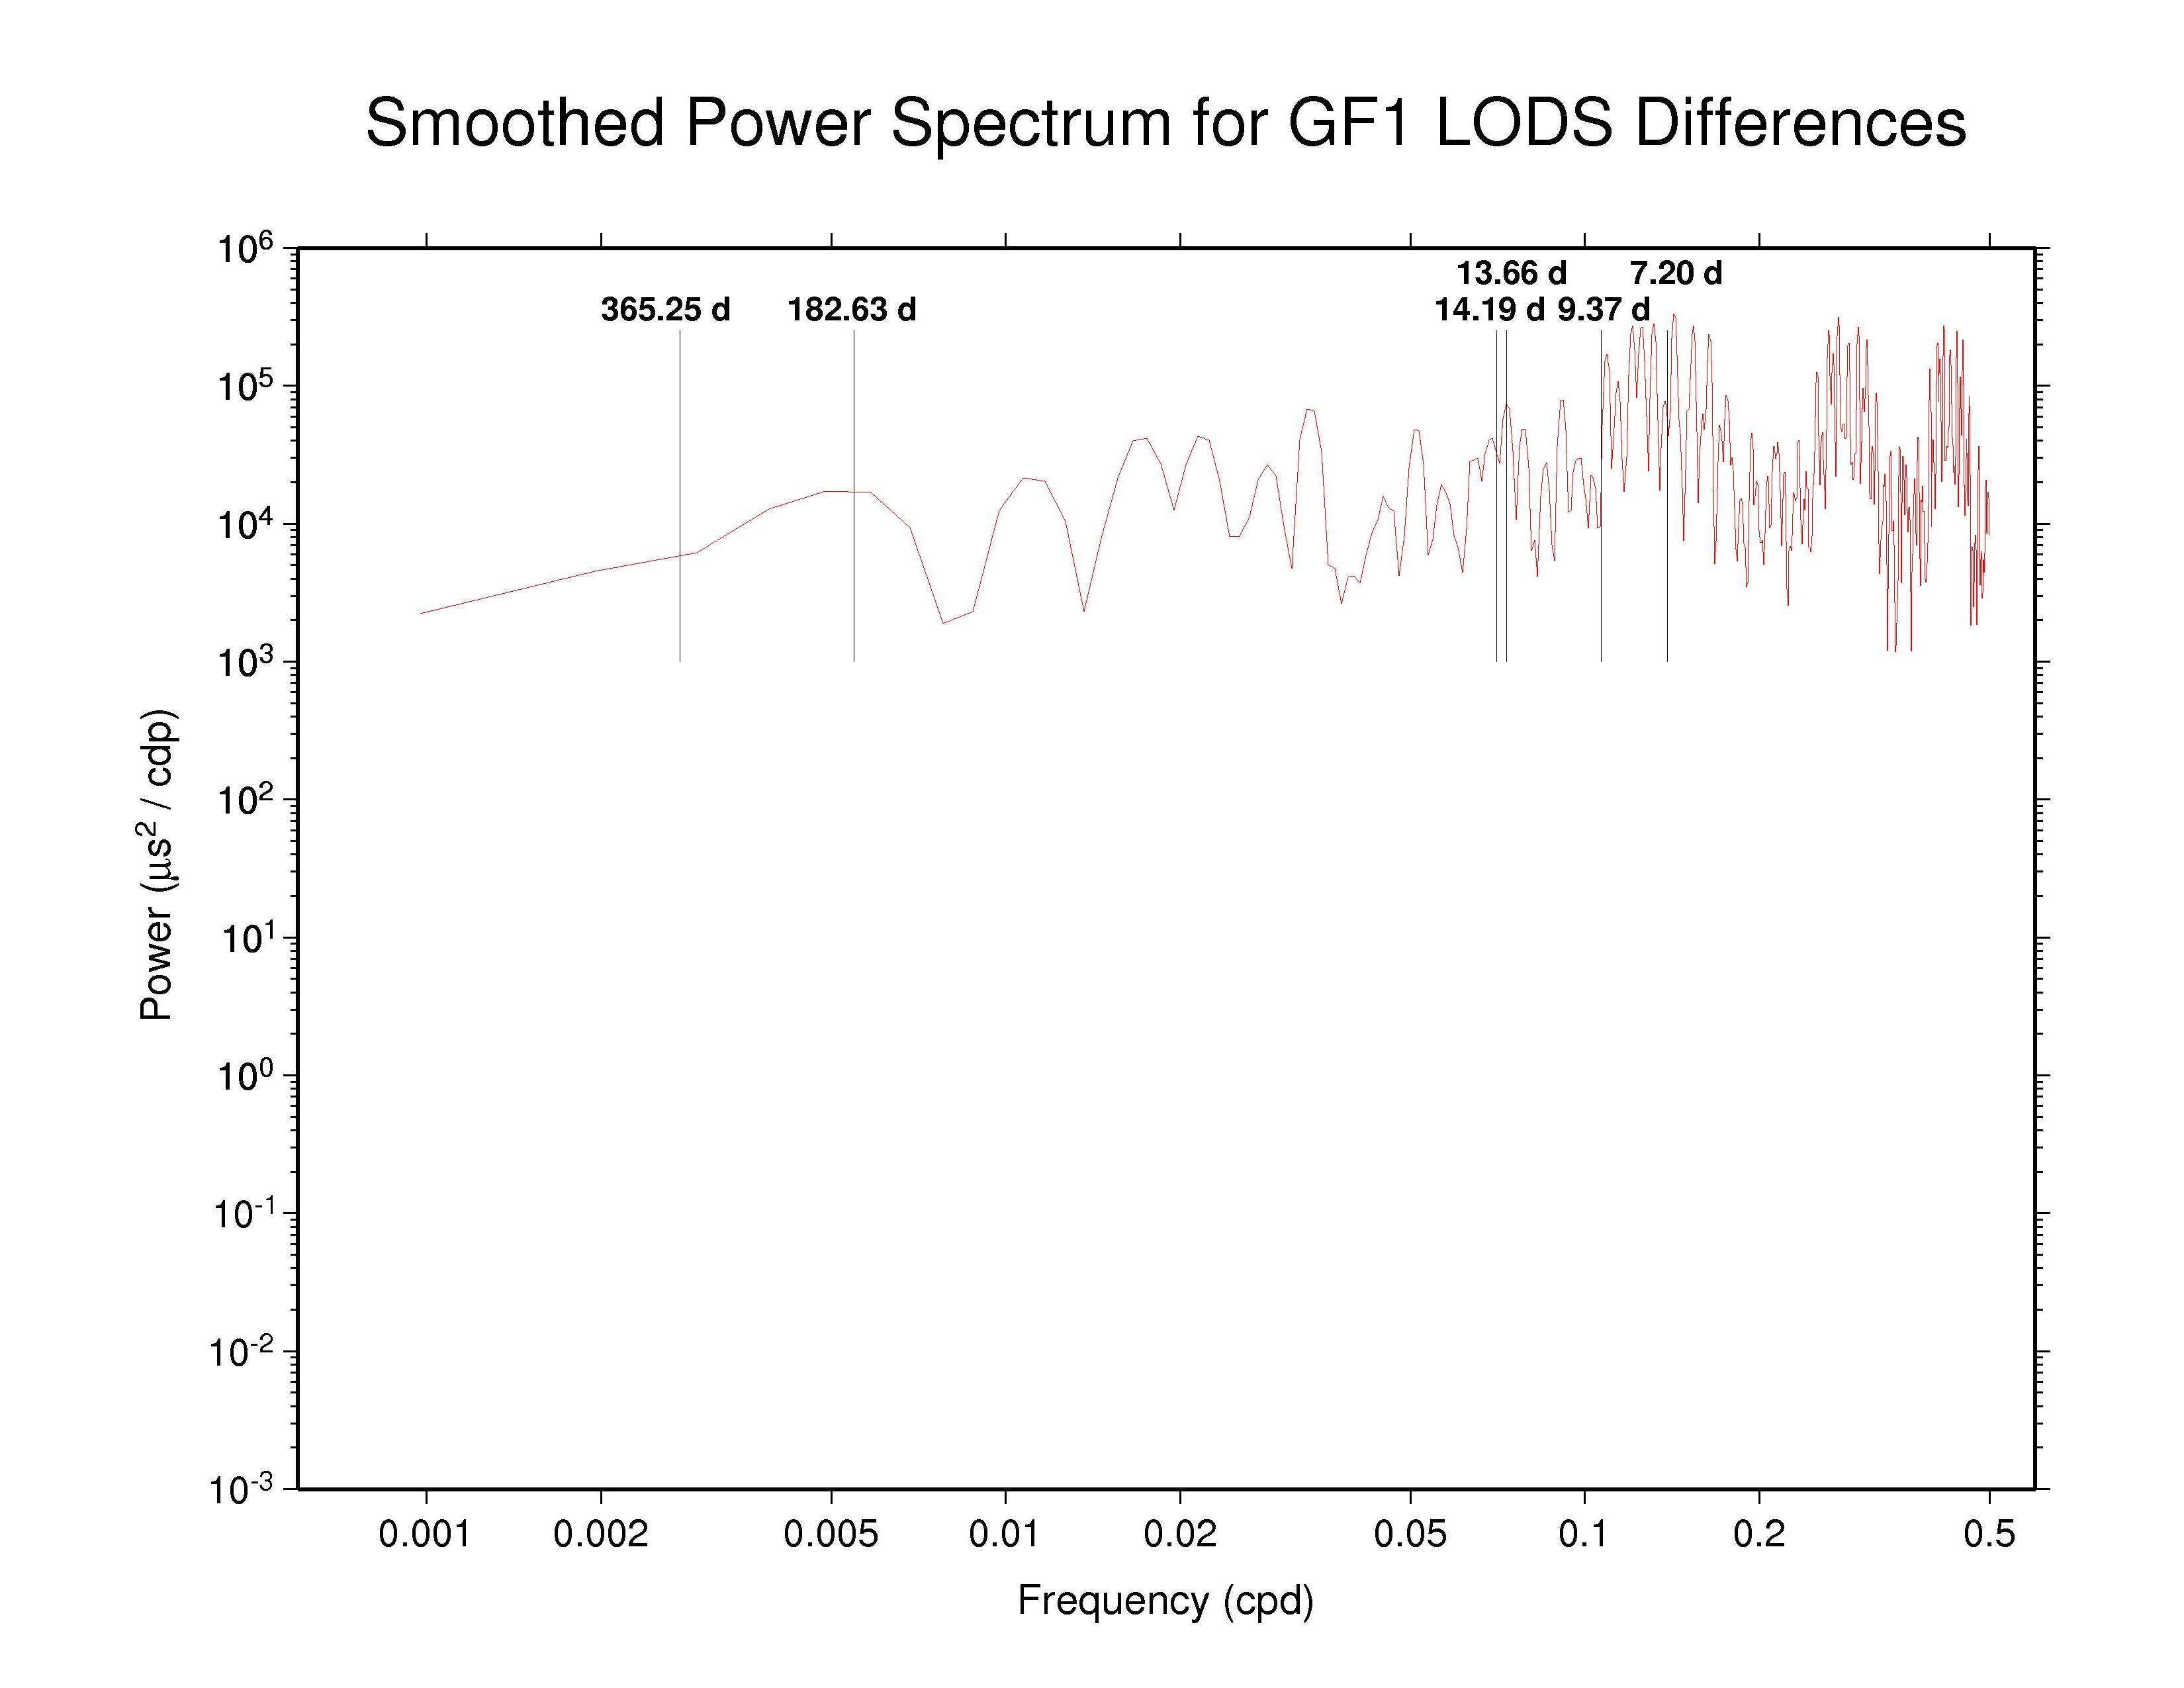 GFZ —
ps file GFZ —
ps file
|
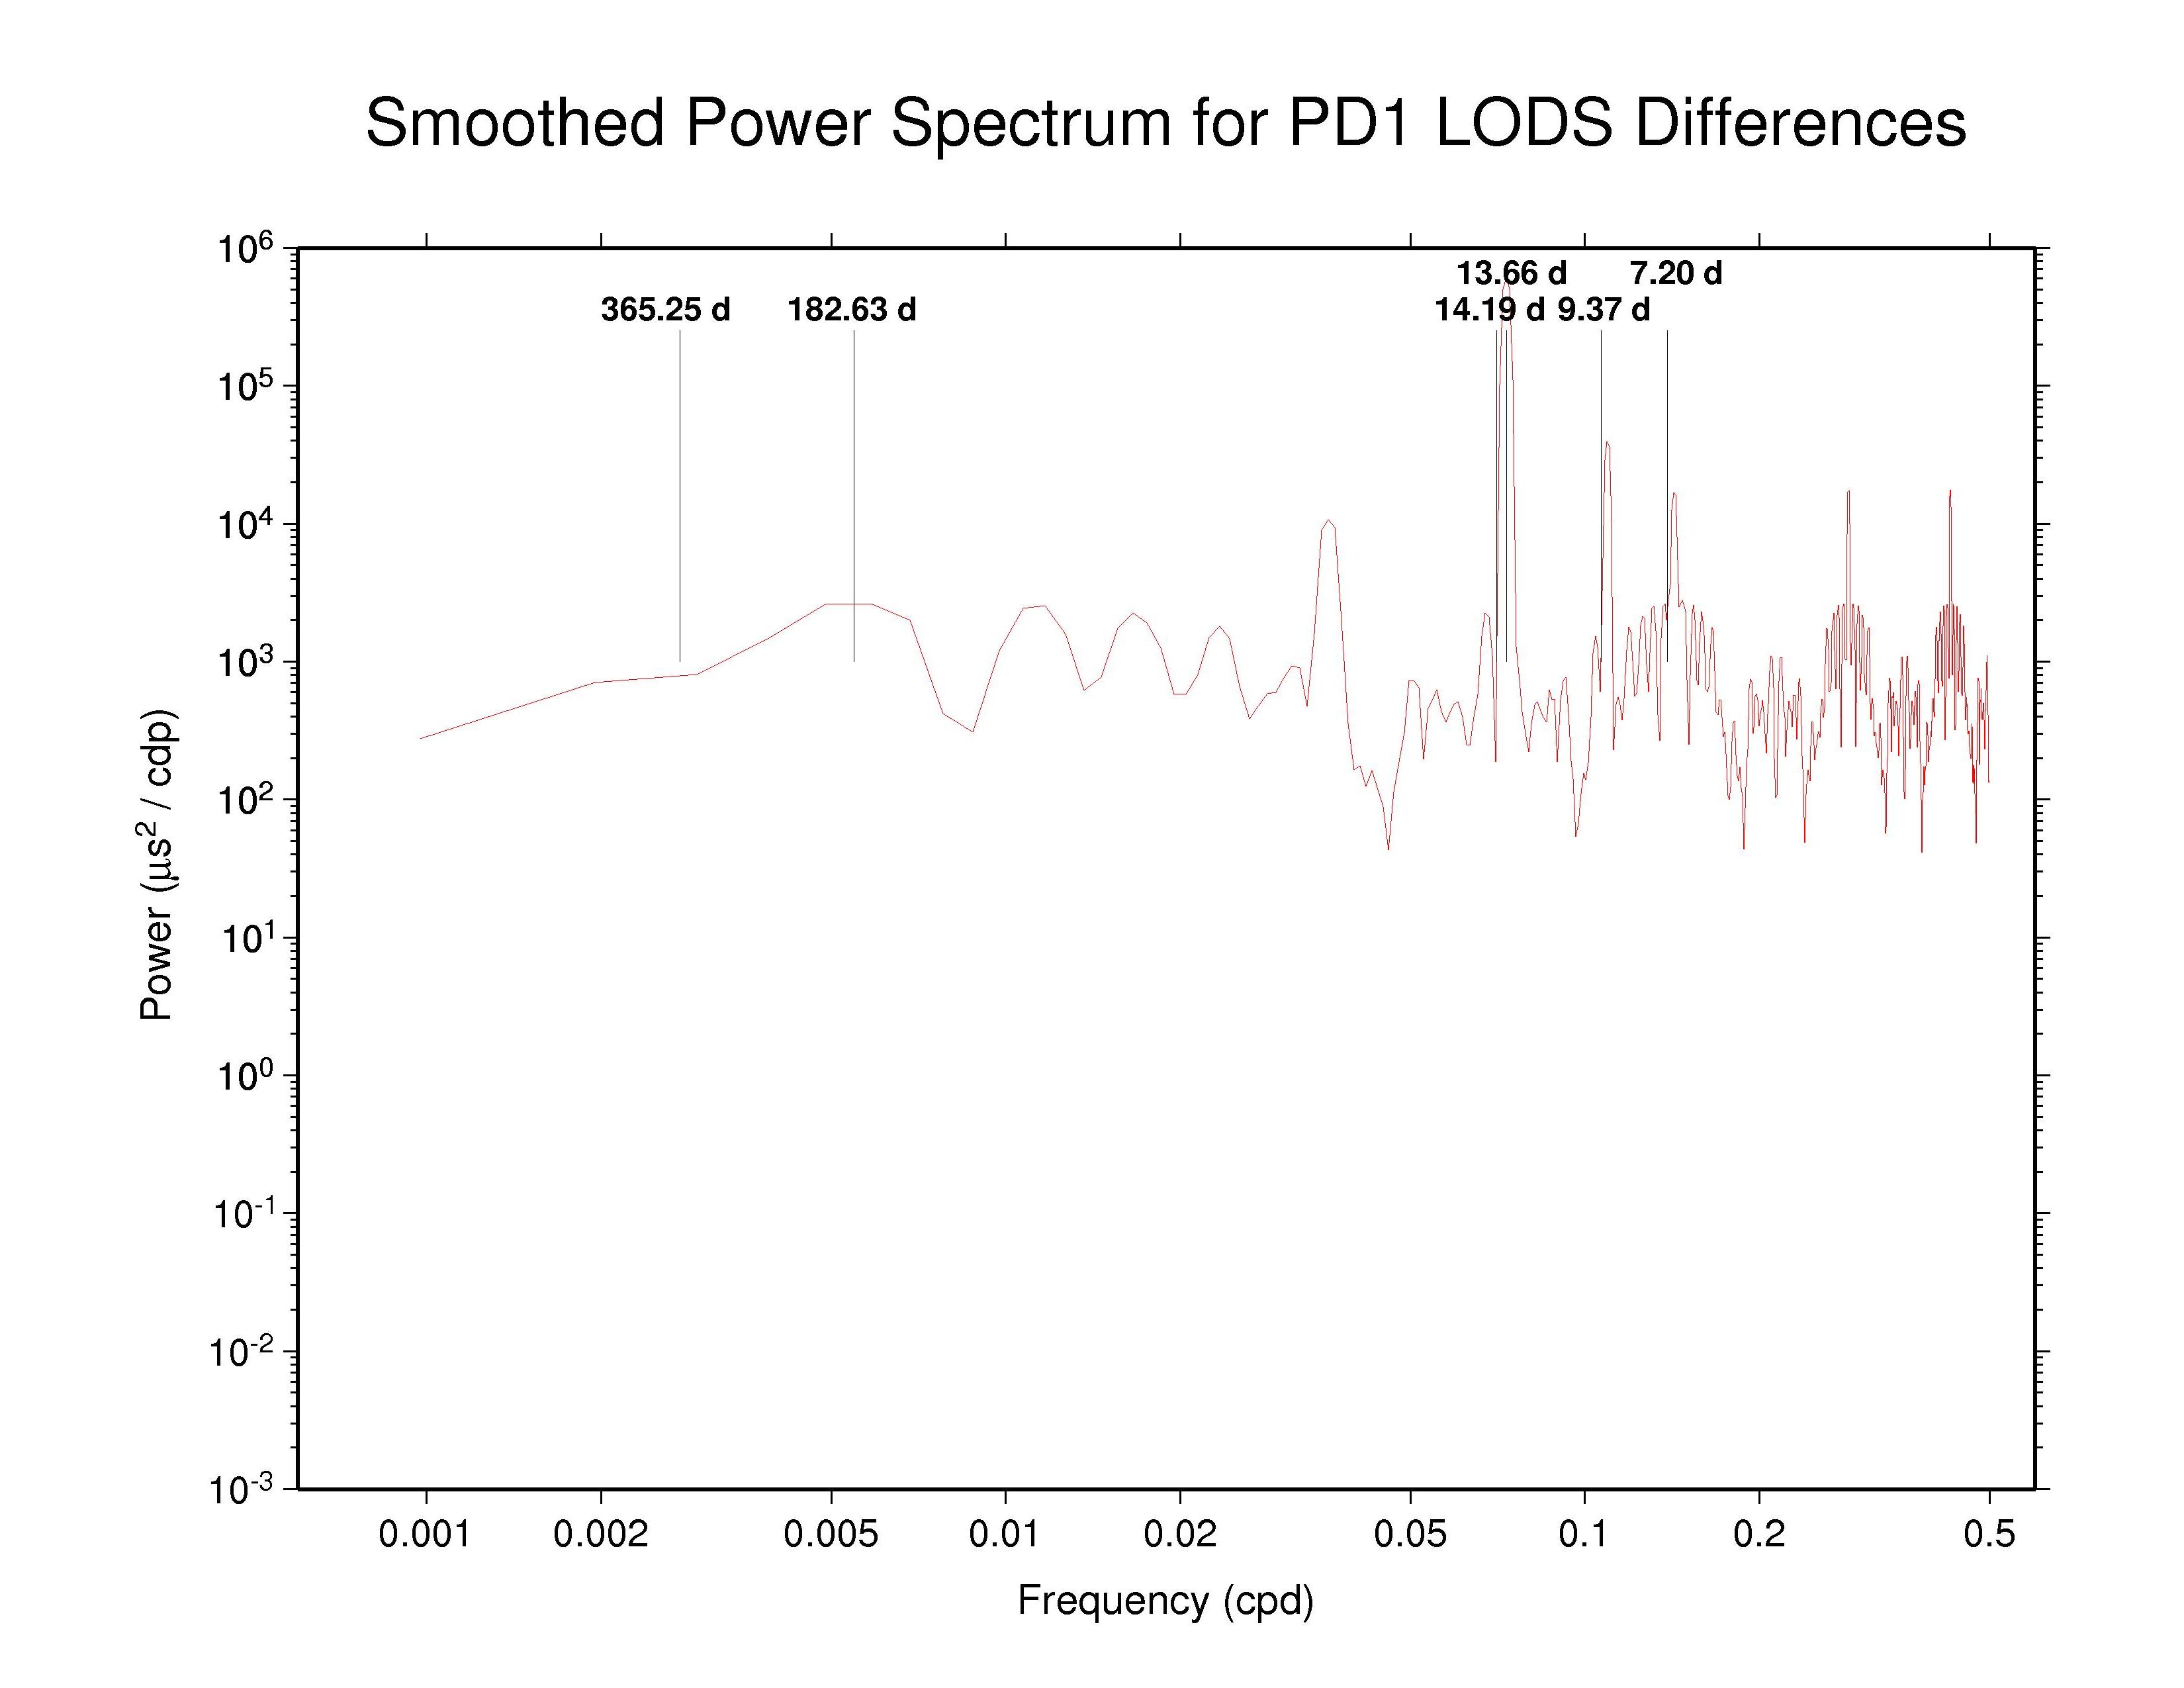 PDR —
ps file PDR —
ps file
|
GFZ and PDR (and perhaps other ACs) both have interesting dense UT1S/LODS spectral features around the weekly period and its second and third harmonics, which is not surprising for a weekly fixation of UT1. For GFZ, however, these features match the similar structures seen above in their reprocessed day-boundary orbit discontinuities. In principle, one might imagine that a causal relationship could operate in either direction. However, it seems more likely that weekly UT1 fixation has somehow affected the GFZ and PDR orbit nodes and induced corresponding errors in their orbits. (GTZ has not submitted reprocessed orbits.) The even starker weekly UT1S/LODS discontinuity resonances in the PDR spectrum are less clearly expressed in their orbit spectra than for GFZ, possibly because the PDR UT1S/LODS discontinuity power levels are considerably lower than for GFZ. So rather than inducing clear features in the PDR orbit spectra, the UT1 fixation effect appears only as an excess of high-frequency orbit scatter.
The table below summarizes the features that can be observed in the spectra of the AC orbit discontinuity plots above.
| Features in Spectra of AC Day-boundary Orbit Discontinuities | |||||
| AC | annual | semi-annual | tidal/other bands | 1.040 cpy harmonics | Remarks |
| COD | - | Y | 14 d band | 4th | 3 * 24 hr arc |
| EMR | - | Y | 14 d band | 4th, 6th, 8th, 10th | 24 hr arc |
| ESA | - | ? | 14 d band | 4th? | 24 hr arc |
| GFZ | - | Y? | 7 d comb, 3.5 d comb, 2.33 d comb | 4th, 6th, 10th | 3 * 24 hr arc |
| JPL | - | Y | 14d band | 4th, 6th | 3 + 24 + 3 hr arc |
| MIT | - | ? | 14 d band, 7 d band? | 4th | 24 hr arc |
| NGS | ? | - | 14 d band | 4th, 6th, 8th | 24 hr arc |
| PDR | ? | ? | too noisy | 4th?, uncertain | 3 * 24 hr arc |
| SIO | - | Y | 14 d band, 7 d band? | 4th, 8th? | 24 hr arc |
| ULR | - | ? | 14 d band, 4 d band? | 3rd | 24 hr arc |
| Send comments to Jake Griffiths | (updated 13 May 2009) |